Author: Roman Denisov
GEORADAR-EXPERT project leader
info@gpr-soft.com
Introduction
This
publication presents the results of processing the data obtained during the
study of the lunar soil using the geophysical device for electromagnetic
subsurface sounding Lunar Penetrating Radar (LPR). LPR is part of the
scientific equipment complex of the Yutu-2 lunar rover, which has been
performing research tasks on the surface of the far side of the Moon since
January 2019 as part of the Chinese space mission Chang'e-4.
LPR data
processing was performed using the GEORADAR-EXPERT software system in two ways. One of
them was to apply amplitude-frequency transformations to LPR signals to
minimize the masking effect of interference on reflections from the boundaries
of lunar soil layers. In another way, with the help of automated analysis of
the Back-Scattering Electromagnetic Field BSEF (for more details on BSEF
analysis, see here), the
transition was made from the presentation of information about the subsurface
environment in the form of a radarogram, to the presentation of information
about this environment and the wave field reflected from it in the form of an
attribute section. Based on the results of the BSEF analysis, sections of the
real part of the complex relative permittivity, center frequency and Q-factor
were obtained, which made it possible to reveal the structural features of the
lunar soil and the stages of its formation in the investigated depth
range.
In
fig. 1 shows a screenshot of the main window of the GEORADAR-EXPERT software
system in the mode of operation with the results of BSEF analysis. In the left
part of the main window, there are elements of visualization of BSEF analysis
results and settings for creating an attribute section. In the right part there
is the section visualization area and controls for the radargram visualization,
which is located on the adjacent tab and is currently hidden.
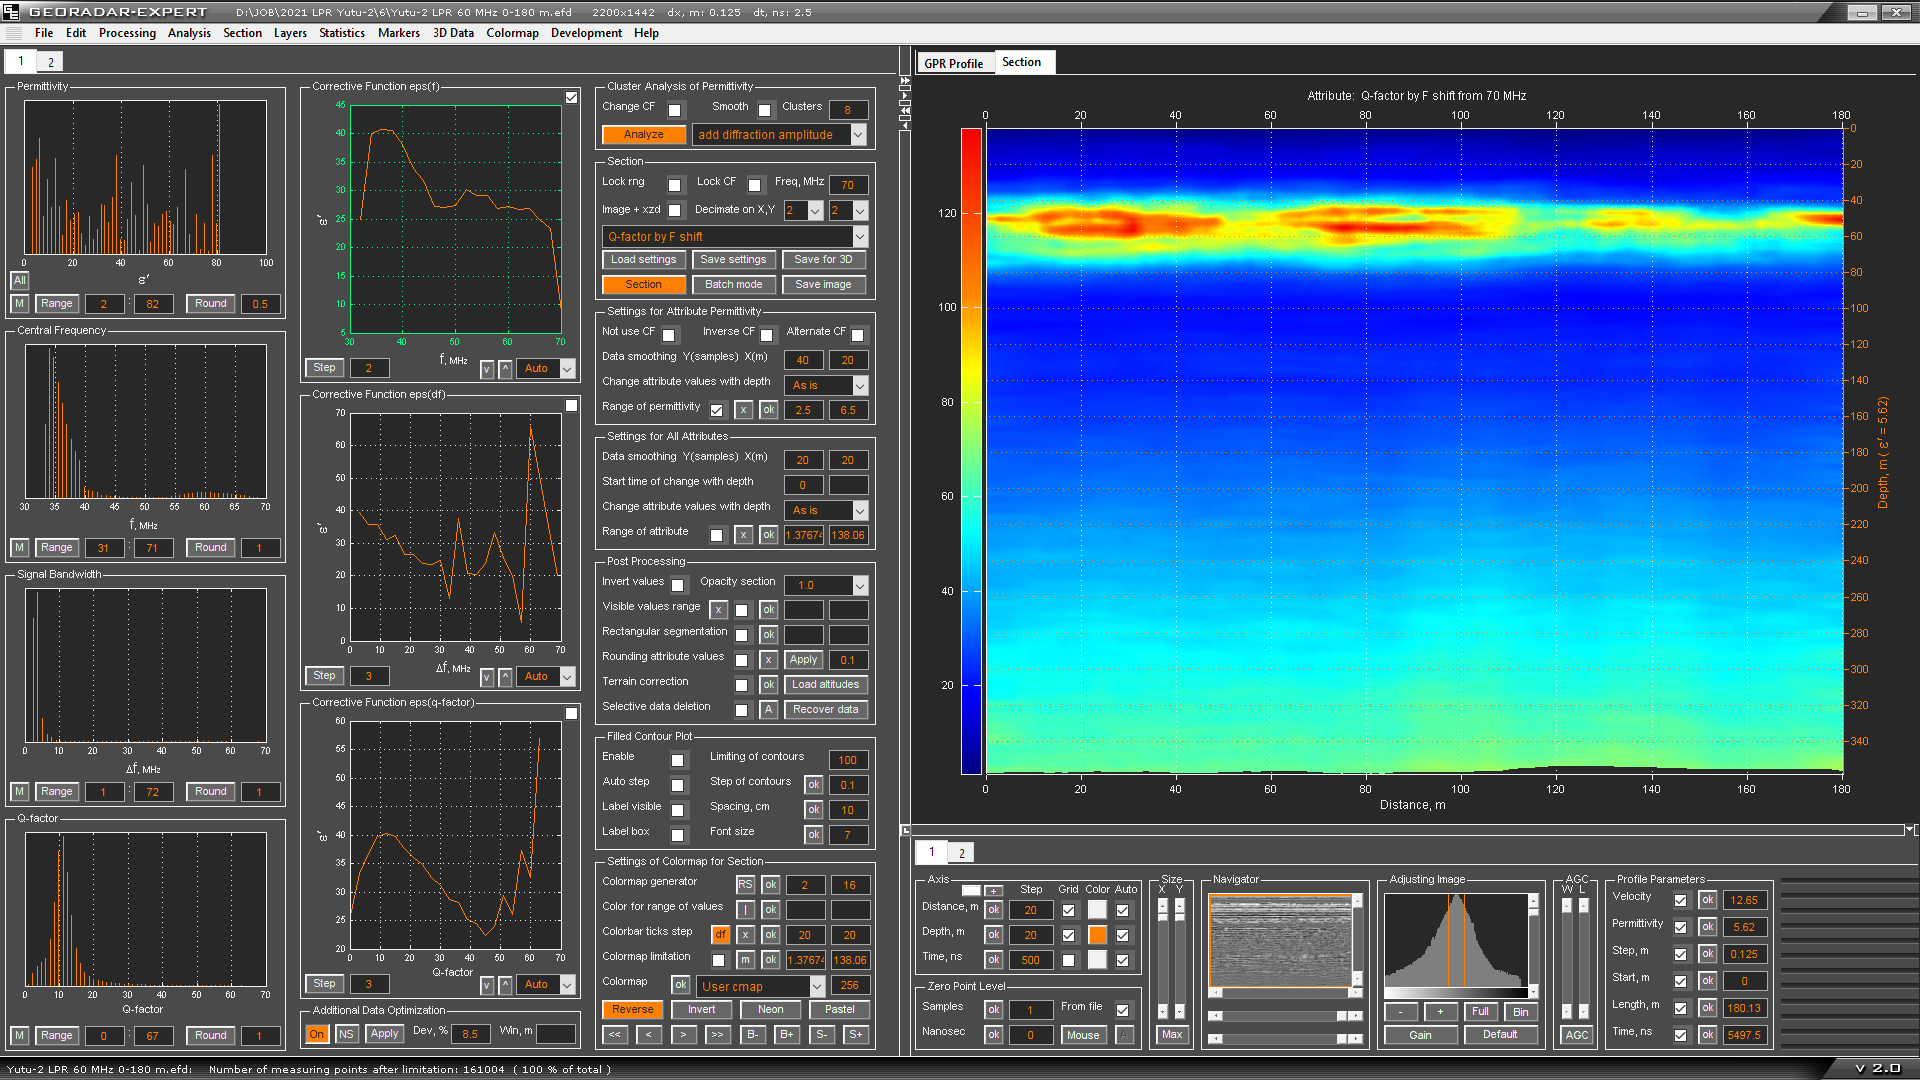
Fig. 1
How LPR Works
LPR is a
ground-penetrating radar designed to work on the lunar surface. The principle
of ground-penetrating radar operation is based on the emission of short
electromagnetic pulses into the investigated subsurface and registration of
reflections from the inhomogeneities of this subsurface. In the ground, such
inhomogeneities are layers with different electrophysical characteristics and
local objects, the linear dimensions of which are comparable to the wavelength
of the probe pulse.
LPR obtains
data on the structure of the lunar soil in the common offset profiling mode.
This is done as follows: at some point on the lunar surface, located on the
lunar rover's path, LPR emits an electromagnetic pulse into the lunar soil,
after which, at regular intervals, it receives the reflections of this pulse
and writes their amplitudes into memory. Thus, a GPR trace is formed.
In the
course of profiling, LPR receives GPR traces for various points of the lunar
surface along the route of the lunar rover. A two-dimensional matrix of
reflected signals is formed from GPR traces, in which GPR traces are located
vertically, and the order in which GPR traces are located horizontally is
determined by the order in which they are received. The image of such a matrix
is called a radargram or GPR profile.
Most often,
the matrix of reflected signals is visualized as an image consisting of pixels,
the brightness of which depends on the amplitude value. The signal matrix
contains both useful signals, which are reflections from real inhomogeneities
of the investigated medium, and various kinds of interference. Interference can
be generated by objects on the ground surface, multiple reflections from a
subsurface object and the influence of electronic devices that generate signals
in the operating frequency band of the GPR. In the presence of interference,
the signal matrix needs processing to minimize the effect of this interference
on the useful reflections.
Fig. 2
shows the result of the first 180 meters of LPR profiling of the lunar soil.
The vertical scale on the left side of the radargram shows the two-way travel
time of the LPR electromagnetic pulse in nanoseconds, the vertical scale on the
right shows the depth in meters, calculated based on the mean value of the real
part of the complex relative permittivity indicated in brackets. The horizontal
scales show the distance traveled by the lunar rover in meters.
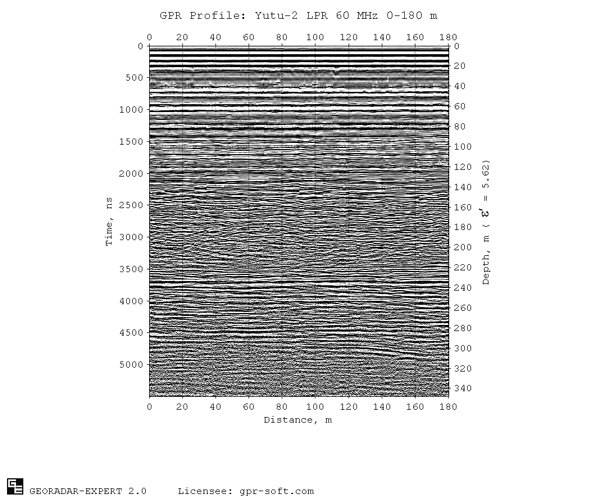
Fig. 2
LPR Features
The depth
of the GPR survey depends on the center frequency of the GPR antennas. The
lower the frequency, the slower the sounding pulse decays, and the deeper it
penetrates into the investigated subsurface. However, the use of a
low-frequency antenna to increase the depth of investigation leads to a
deterioration in the resolution of the GPR profile signals.
To ensure
acceptable resolution of GPR signals and depth of investigation, LPR is
equipped with two antennas, differing in design and tuned to different
frequencies. Thus, the LPR of the Yutu-2 lunar rover is a two-channel radar.
The
first channel operates at a center frequency of 60 MHz, the second channel is
tuned to a center frequency of 500 MHz. This publication presents the results
of processing the data of the first LPR channel. The vibrators of the antennas
of the first channel are installed in the rear of the lunar rover, in Fig. 3
they are indicated by arrows. The distance between the vibrators and the
surface of the Moon is about 60 cm.
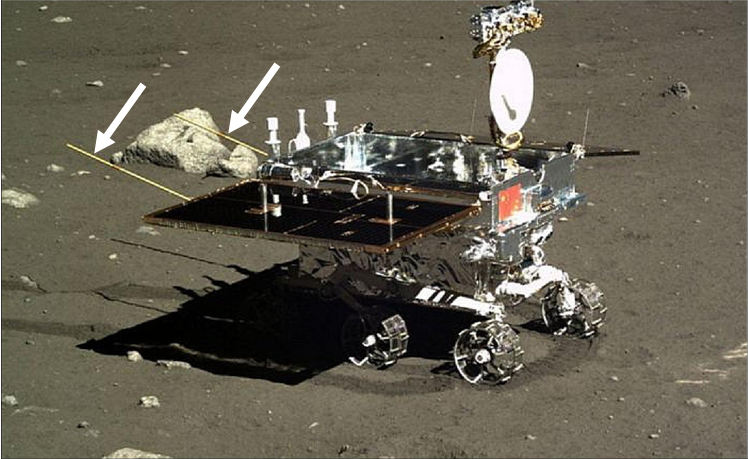
Fig. 3 Source: CASC/China
Ministry of Defense
Research Location
In
January 2019, the lander of the Chang'e-4 space mission made a soft landing in
the Von Karman crater, which is located in the South Pole-Aitken basin (Fig.
4). This
basin is the deepest and oldest impact structure of the Moon, and the size of
2400 × 2050 km makes it one of the largest craters in the solar system. Von Karman crater has a
relatively flat bottom, flooded with basaltic lava, the surface of which is
covered with a layer of regolith.
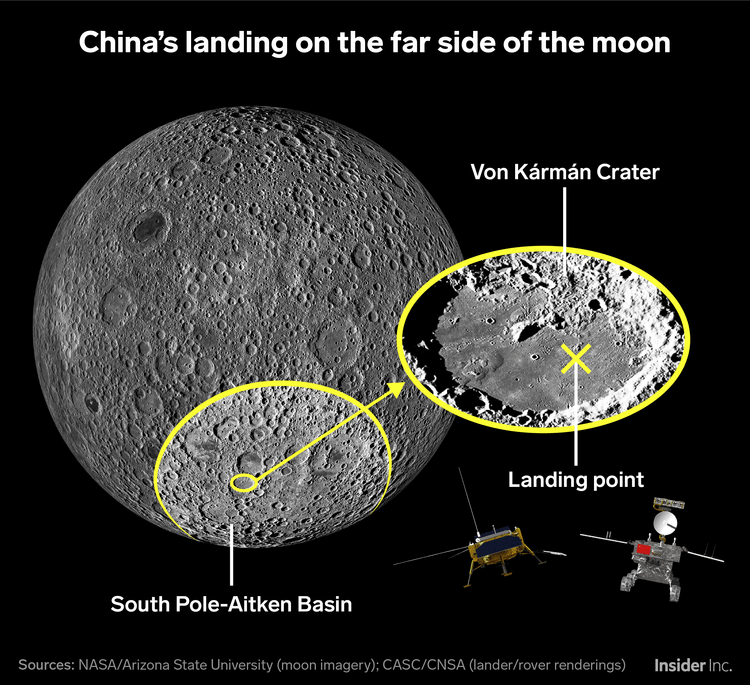
Fig. 4
Fig. 5 shows a scheme of the moving of the Yutu-2
lunar rover during the first nine-month stage of the lunar exploration. Route
waypoints are shown with yellow round markers and are numbered. Waypoint 1 is
located next to the Chang'e-4 lander, the position of which is indicated by
CE4. Waypoints are numbered in order of increasing distance traveled. This
scheme for moving the lunar rover is taken from the article by Lai, J., Xu, Y., Bugiolacchi, R. et al.
First look by the Yutu-2 rover at the deep subsurface structure at the lunar
farside. Nat
Commun 11, 3426 (2020).

Fig. 5 Source: Lai, J., Xu, Y., Bugiolacchi, R. et al. First look by the Yutu-2 rover at the deep subsurface structure at the
lunar farside. Nat Commun 11, 3426 (2020)
Next, the processing of the result of LPR profiling
of the first 180 meters of the lunar rover route is considered. The start of
profiling corresponds to the position of waypoint 1, the end of the profiling
corresponds approximately to the position of waypoint 31.
LPR Data Processing
This
publication presents the results of processing LPR data in two ways. One way is
to process GPR profile signals in order to suppress interference and highlight
the boundaries of lunar soil layers on the radargram. The second method is an automated
analysis of the Back-Scattering Electromagnetic Field BSEF to determine the
electrophysical characteristics of the lunar soil layers.
The
features of the lunar radargram are due to the design of the LPR 60 MHz
antennas and the properties of the lunar soil. The 60 MHz antenna vibrators are
not shielded. For this reason, useful reflections on the radargram are masked
by interference in the form of reflections from objects located on the surface
of the Moon - stones, craters and parts of the lunar rover.
The
greatest masking effect on LPR signals reflected from the inhomogeneities of
the lunar soil is produced by multiple reflections from the metal elements of
the lunar rover structure. Since metal is a good reflector of radio waves, the
reflections from the lunar rover have the highest amplitudes. These reflections
appear on the radargram as horizontally oriented lines that are present
throughout the GPR profile and appear in the entire range of reflection
registration time. Such stability of this interference is caused by the fact
that the distance between the antenna vibrators and the lunar rover is constant
and does not change over time. In addition, reflections from different parts of
the lunar rover interact with each other, mutually reinforcing or suppressing,
depending on their phase relationships.
Compared to
reflections from the lunar rover, the amplitudes of reflections from stones
located on the lunar surface and craters are noticeably lower. This is because
these objects do not have such a good reflectivity as the metal elements of the
lunar rover. Part of the energy of LPR probing pulses is absorbed by the
substance that make up objects on the surface, and part is scattered by these
objects in space and does not fall into the receiving LPR antenna.
As the
probe electromagnetic pulse passes through the subsurface medium, the frequency
composition of this pulse changes. Soil layers with similar characteristics
distort the GPR sounding pulse in a similar way. Due to the fact that the
electrophysical characteristics of the lunar soil and the highly rarefied
atmosphere of the Moon differ significantly, the frequency composition of
reflected LPR pulses from subsurface objects and objects on the lunar surface
will also have noticeable differences. Consider the spectrum of LPR profile
signals. Fig. 6, on the left, the original, unprocessed, 60 MHz LPR radargram
is shown; on the right, the amplitude spectrum of the signals of this radargram
is shown.
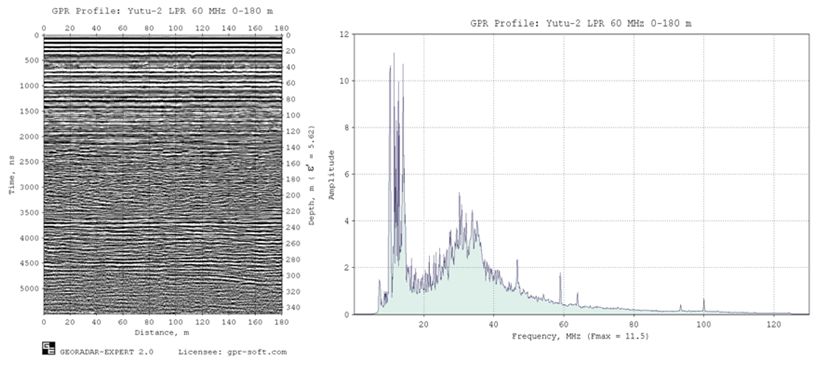
Fig. 6
The
spectrum can be divided into two frequency ranges, within each of which the
spectrum line has a Gaussian-like shape. These bands border around 20 MHz. This
form of the spectrum indicates that there are two groups of signals on the GPR
profile, well spaced in frequency. In one of the frequency ranges, useful
signals can be concentrated, and in the other, interference.
The
fact of the presence of high spectral amplitudes in the frequency range up to
20 MHz suggests that this range is occupied by interference from the structural
elements of the lunar rover. To check the truth of this assumption, it is
necessary to isolate these noises and obtain their spectral image. Fig. 7 shows
the result of the selection of horizontally oriented interference using the
singular decomposition of the GPR signal matrix implemented in the
GEORADAR-EXPERT software system and the spectrum of these interference.
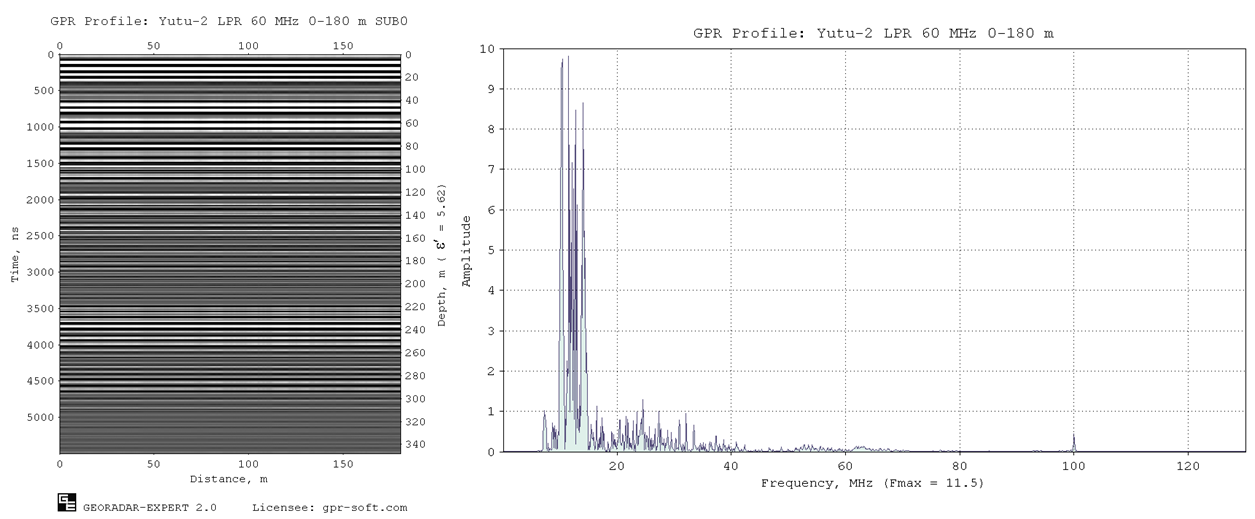
Fig. 7
lunar rover body is indeed concentrated in the
frequency range up to 20 MHz. Fig. 8 shows the radargram and its spectrum after
the procedure for suppressing the frequency range below 20 MHz to minimize the
effect of interference from the lunar rover. Suppression was performed using
band-pass filtering implemented on the basis of Fourier transforms.
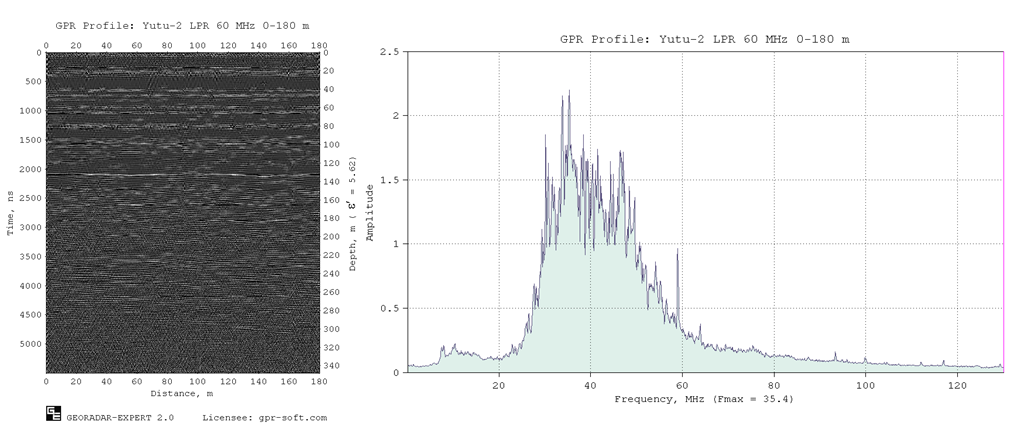
Fig. 8
As a result
of filtering, the interference from the lunar rover is suppressed, but the
interference generated by other objects on the lunar surface and random noises
still overlaps reflections from the boundaries of the lunar soil layers in many
places, which is why these boundaries look too fragmentary on the radargram.
Interference occupies frequencies close to useful signals, from the side of the
high-frequency region of the amplitude spectrum.
To improve
the visualization of reflections from layer boundaries, it is can lower the
center frequency of these reflections on the radargram and increase their
amplitude. As a result of these actions, the interference will be covered by
the more intense low-frequency wanted reflections. For such tasks, the
B-Detector (Boundaries Detector) module is implemented in the GEORADAR-EXPERT
software system.
With the help of
B-Detector, the user changes the amplitude, frequency and duration of
reflections on the radargram. As a result, the radargram looks as if it was
recorded using an antenna that differs in its frequency characteristics from
the actually used GPR antenna. Fig. 9 shows the radargram and the spectrum of
its signals after using the B-Detector module to reduce the frequency of useful
signals.
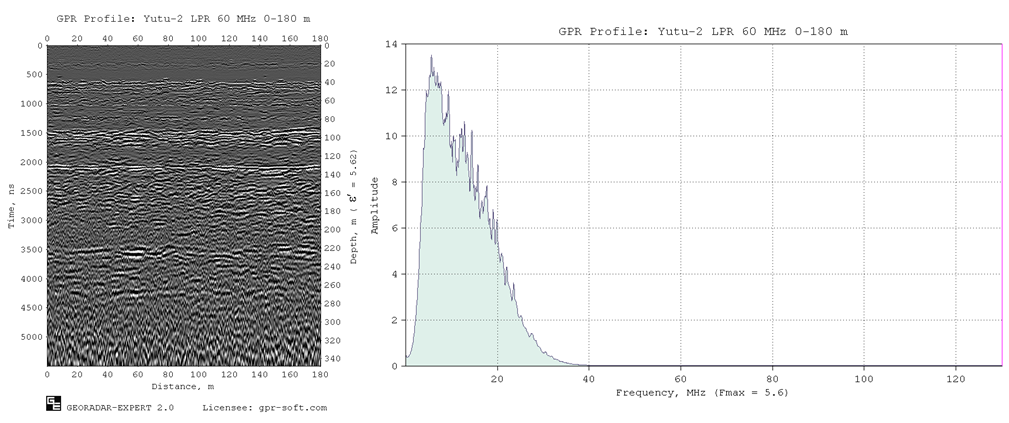
Fig. 9
As a result of using the B-Detector module, reflections
from the boundaries of the lunar soil layers began to look better, reflections
from the layer boundaries appeared in the time range of 3500 - 4500 ns. In fig.
10 shows a GPR trace before and after processing in the B-Detector module. On
the graphs, the vertical scale shows the amplitudes, the horizontal scale - the
numbers of the GPR trace samples.
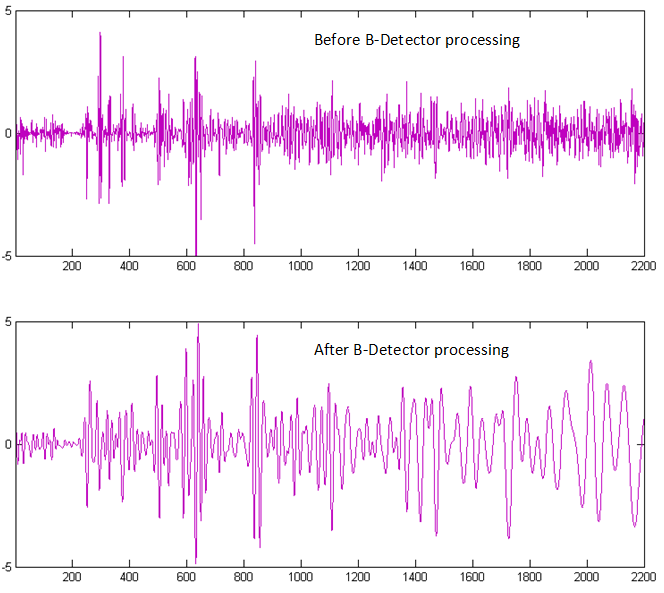
Fig. 10
Fig. 11 shows the result of processing LPR data on
a larger scale of the image.
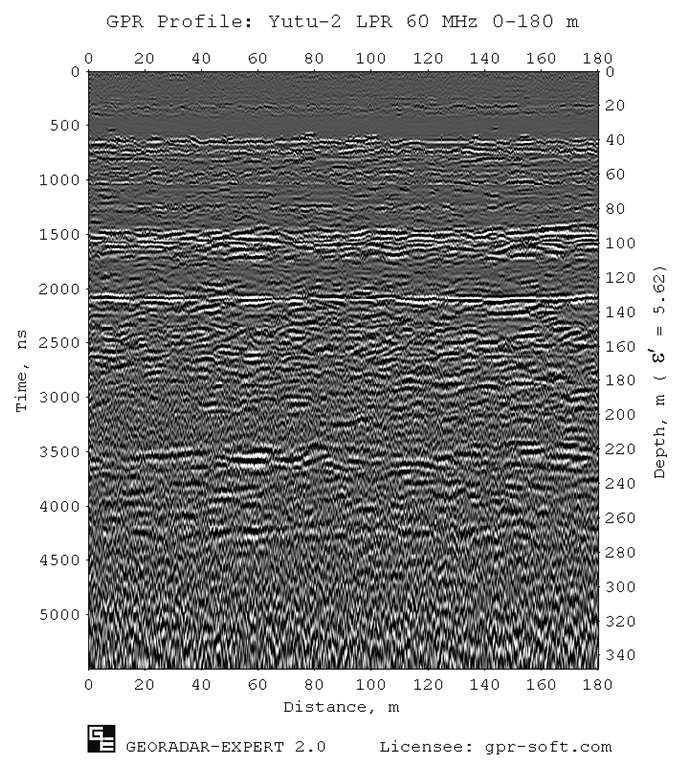
Fig. 11
Thus, in the course of LPR data processing, the frequency
range up to 20 MHz occupied by the interference from the lunar rover was
suppressed, and useful reflections were moved to this range. As a result,
reflections from the boundaries of the lunar subsurface layers are observed on
the radargram. These reflections give an idea of the position of the layers
on the section, but do not give, to a sufficient extent, an idea of the
properties of the layers and the change in these properties within the layer.
This problem can be solved with the help of automated analysis of the
Back-Scattering Electromagnetic Field
(BSEF).
Exploring Lunar Soil Structure Using the BSEF Automated Analysis
In
georadiolocation, the reflection of the probe pulse from the boundary between
the layers is formed only if there is a sufficient difference in the values
of the permittivity in the contact area of these layers. If the contact of
the layers has a diffuse nature, in which the permittivity changes smoothly,
and not abruptly, then there will be no reflection from such a boundary on the
radargram. In the case of a smooth change in the electrophysical
characteristics of the subsurface medium along the entire length of the GPR
profile and in the entire range of depths of the GPR survey, the radargram will
not contain reflections from the boundaries of the layers.
Diffracted
reflections can be used to obtain information about the permittivity of areas
of the subsurface medium. Diffracted reflections create local objects, the
sizes of which are comparable to the wavelength of the GPR probe pulse. The
geometry of the diffracted reflection on the radargram depends on the average
speed of propagation of the probe pulse from the GPR antenna to the local
object. Based on the value of the average velocity obtained from the measurement
of the geometry of the diffracted reflection, the average value of the
permittivity for the thickness limited by the GPR antenna and the position
depth of the local object is calculated.
The more
diffracted reflections from subsurface local objects a radargram contains, the
more detailed information about the structure of the subsurface environment can
be obtained. However, the number of diffracted reflections on the radargram,
suitable for such measurements, is often insufficient to obtain a detailed image
of the structure of the section, reflecting all its features. It often happens
that there are only a few diffracted reflections on the radargram, and
sometimes they are completely absent.
The
above-mentioned difficulties can be overcome with the help of BSEF automated
analysis, specially developed for the GEORADAR-EXPERT software system. The use
of the results of this analysis allows for the transition from visualization of
information about the subsurface medium in the form of a radargram, to
visualization of the characteristics of this medium and the reflected wave
field in the form of an attribute section.
To
solve a wide range of georadiolocation tasks, the GEORADAR-EXPERT software
system contains more than two dozen attributes. Attributes are the parameters
of the reflected wave field, which is displayed on the radargram, and their
derivatives obtained as a result of various transformations. Presentation of
GPR information in the form of an attribute section significantly increases the
information content of GPR research and makes the result of this study more
understandable, and the use of the statistical analysis module, also
implemented in GEORADAR-EXPERT, helps to identify the relationship of
attributes between themselves and the physical and mechanical characteristics
of the studied subsurface.
Permittivity Attribute Section
Fig. 12 shows a section of the real part of the
complex relative permittivity (hereinafter referred to as the permittivity),
obtained from the results of the automated BSEF analysis of the LPR data.
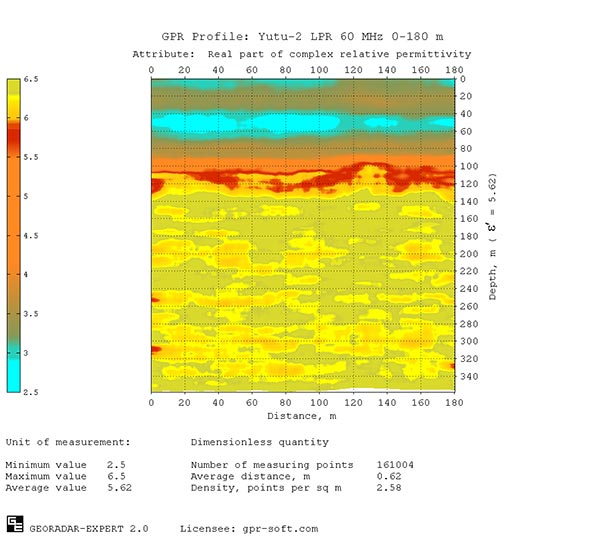
Fig. 12
The scale
of correspondence of the color gamut of the section to the values of the
permittivity is shown to the left of the section image. At the bottom of the
image are the statistical indicators of the section. These are the minimum,
maximum and average values of the section attribute, the number of automated
analysis points, according to which the section was calculated (Number of
measuring points), the average distance between BSEF analysis points in meters
(Average distance) and the average number of BSEF analysis points per square
meter of the section area (Density).
The term
'BSEF analysis point' means a point on the GPR profile, in the neighborhood of
which, during the automated BSEF analysis, the characteristics of the reflected
signals are measured. As a result, a set of attribute values is assigned to the
analysis point - amplitude, frequency, spectrum width, permittivity, etc.
In the
section, close values of the attribute form layers that give an knowledge of the
structure of the investigated subsurface. Fig. 13 shows a variant of
visualization of a section, where the values of the permittivity inside the
layer are the same over the entire area of the layer and are equal to the
average value of the permittivity in this layer.
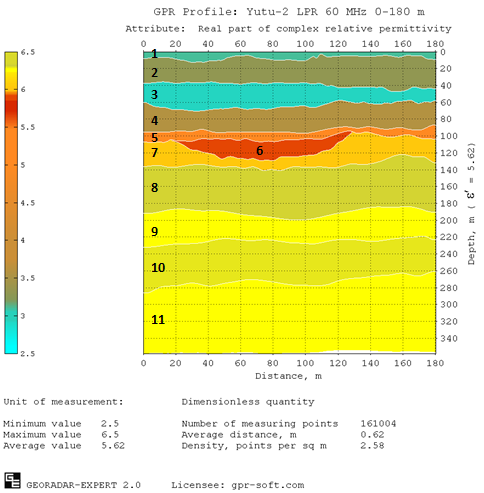
Fig. 13
The layers on the section are numbered in ascending
order of the average position depth of the layer. Statistical indicators for
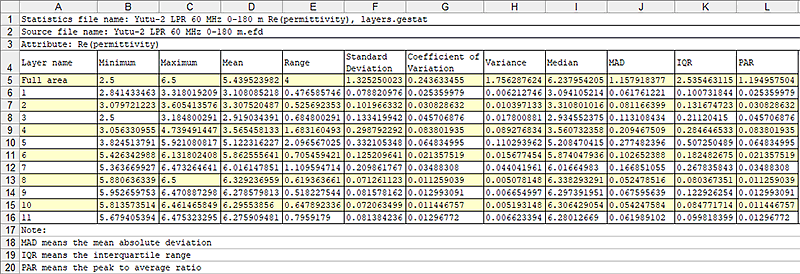
the for the permittivity values by layers are presented in tab. 1.
Tab. 1
The permittivity of the section is in the range of
2.5 - 6.5. In the section, layers 3 and 6 are of the greatest interest.
Layer 3
Layer 3 has
the lowest average permittivity, most of the area of this layer has a
permittivity below 3. The thickness of layer 3 varies from 11.6 m to 33.7 m,
the average is 24.8 m. The depth of the top of layer 3 varies from 36.1 to 47.8
m, and the base of the layer is from 58 to 70.8 m.
As a
hypothesis for the formation of layer 3, we can consider the assumption that
this layer is a lava tube, i.e. tunnel formed by the flow of a volcanic
eruption. The lava tube is formed in the following way: during the eruption,
the surface lava flow quickly cools down, forming a crust. The crust acts as a
heat insulator for the internal flow of hot lava. At the end of the eruption,
the still uncooled lava flows down the slope, leaving behind extended voids,
called lava tubes. The low values of the permittivity of layer 3, ranging
from 2.5 to 3.2, suggest that layer 3 can be a lava tube partially or
completely filled with water ice.
Layer 6
Unlike the
rest of the lunar soil layers, Layer 6, located inside Layer 7, has a bowl-like
shape, resembling a depression that could arise from an impact when a celestial
body collides with the surface of the Moon. The average depth of the upper
boundary of layer 6 is 104 m, and the maximum thickness of layer 6 is 24.4 m.
The length of layer 6 is about 111 m.
Above
layers 6 and 7, there is a thin layer 5, the average thickness of which is 9.4
meters. This layer differs from layers 6 and 7 in its lower average
permittivity value of 5.1. For layers 6 and 7, these values are 5.9 and 6,
respectively. If layer 6 is a crater buried under an almost 100-meter layer of
lunar soil, then it can be assumed that the top of layers 6 and 7 was the lunar
surface for a rather long time.And this period of time was so long that an
almost ten-meter layer of regolith managed to form on the surface. Then there
was a volcanic eruption, or a series of eruptions, as a result of which the
lunar surface was covered with igneous rock about 100 meters thick. This
hypothesis is supported by the distribution of permittivity values over the
depth of the section.
Change in Permittivity by Depth
Fig. 14 shows the dependence of the permittivity on
the layer number. The higher the layer number, the deeper the layer lies. On
the horizontal axis of the graph are the numbers of the layers; on the vertical
axis are the average values of the permittivity in the layer.
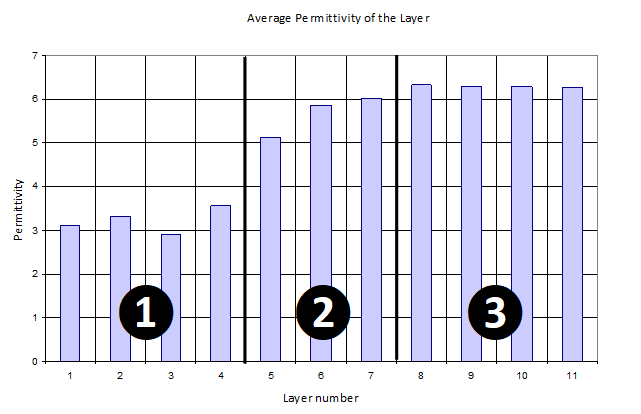
Fig. 14
Using the
graph, you can trace the formation of lunar soil layers within the studied
depth range. The graph can be divided into three parts, corresponding to three
epochs of lunar soil formation within the LPR depth range of the survey. The
graph shows the numbers of the parts and the boundaries between them. Within
each part, the values of the permittivity in the layers have their own common
features.
Part 3
contains the oldest deepest layers, numbered 8-11. These layers have the
highest permittivity, ranging from 5.8 to 6.5. The difference between the
highest and lowest average permittivity for part 3 layers is 0.05 units. Compared
to parts 1 and 2, this is the smallest difference.
Part 2 of
the graph contains layers 5 - 7. Within this part, there is a noticeable
tendency to an increase in the values of the permittivity as the depth
position of the layers increases. It is assumed that the top of layers 6 and 7
was for a long time the surface of the Moon, bombarded by solid particles from
space, and on this surface, over time, a regolith layer was formed, which
corresponds to layer 5. The difference between the highest and lowest average
permittivity for the layers of part 2 is 0.89 units.
The
youngest layers of the lunar soil belong to part 1, these are layers numbered 1
- 4. Layers 2 - 4 were formed as a result of a volcanic eruption, the products
of which covered the old surface of the Moon with an almost 100-meter layer.
The upper layer 1 consists of fine-grained regolith, layer 3 is a lava tube
containing water ice. The difference between the highest and lowest average
permittivity for Part 1 layers is 0.67 units.
The
difference between the average values of the permittivity of layers 4 and 5,
the boundary between which is the boundary between parts 1 and 2, is 1.56
units, and between layers 7 and 8, which delimit parts 2 and 3, is 0.31 units.
This indicates that the layers of part 2 are closer in their properties to the
layers of part 3 than to the layers of part 1.
Center Frequency Attribute Section
Fig. 15 shows a section of the center frequency,
obtained from the results of the automated BSEF analysis of the LPR data.
Section visualization is presented in two versions: without showing layering
(left) and with layers (right). The frequency values within a layer are the
same over the entire area of the layer and are equal to the average value of
the central frequency in this layer.

Fig. 15
From the
point of view of georadiolocation, a subsurface layered medium can be viewed as
a set of frequency filters, in which each layer is represented by a filter with
its own pass-band frequencies. Using the central frequency section, one can get
an idea of the frequency characteristics of the layers of the studied soil and
interpret the sections of the section that have close frequency values as layers
with similar characteristics of physical and mechanical properties.
The
structure of the section of the central frequency is similar to the section of
the permittivity, from which it follows that the change in the values of the
permittivity in the lunar soil has a pronounced frequency-dependent character.
Fig. 16 shows plots of permittivity (left) and center frequency (right) versus
layer number.

Fig. 16
For the GPR
profile under consideration, the graphs make it possible to formulate the
pattern of changing the attribute values with increasing layer number, and
hence the depth. If we neglect small, at the level of error, fluctuations in
the values of attributes in layers 8 - 11, this pattern can be formulated as
follows: as the depth increases, the permittivity of the lunar soil increases,
and the center frequency of the reflected signals decreases.
The only
layer for which this pattern is violated is layer 3. The violation is
highlighted in red on the graphs. The fact of such a violation characterizes
layer 3 as an anomaly, not similar in composition to other layers of the lunar
soil. This supports the hypothesis that layer 3 is a lava tube.
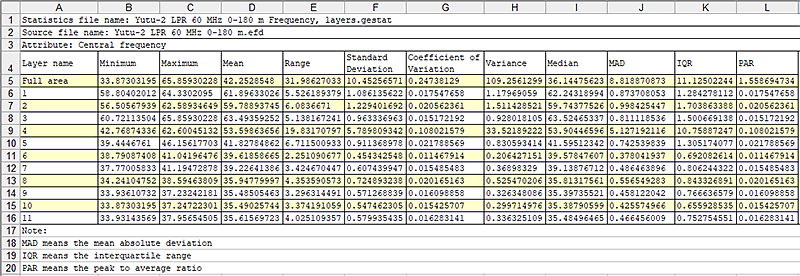
Statistical
indicators for the section of the central frequency by layers are presented in
tab. 2.
Tab. 2
As in the case of the permittivity section, the
difference between the average values of the center frequency for layers 4 and
5 is greater than for layers 7 and 8. These values are 11.8 and 3 MHz,
respectively. Thus, the section of the central frequency confirms the
conclusion drawn on the basis of the analysis of the cut of the dielectric
constant that the layers of part 2 are closer in their properties to the layers
of part 3 than to the layers of part 1 (see Fig. 14).
Q-factor Attribute Section
The difference between layer 3 and other layers is
most pronounced in the section of the Q-factor attribute, the values of which
are calculated according to the formula given in the article by John H. Bradford, Boise State University,
'Frequency-dependent attenuation analysis of ground-penetrating radar data',
GEOPHYSICS. VOL. 72, NO. 3 MAY-JUNE 2007; P.J7-J16. Fig. 17 shows a section
of the Q-factor attribute and a graph of the average Q-factor values by layer.

Fig. 17
The Q-factor section and the graph show that against
the background of a smooth increase in the Q-factor attribute values with
increasing depth, layer 3 stands out sharply in the section with its
anomalously high attribute values. This indicates a significant difference in
the properties of layer 3 from the properties of other layers of the section.
As in the case of the permittivity and the central frequency, this fact
supports the hypothesis of the formation of layer 3 as a lava tube. The
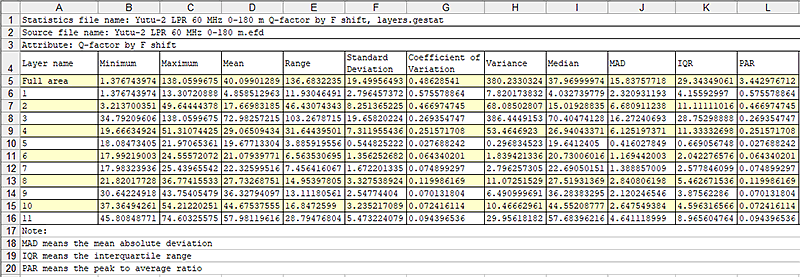
statistical indicators by layers for the Q-factor section are shown in tab. 3.
Tab. 3
As in the case of the permittivity and center
frequency sections, the difference between the average Q-factors for layers 4
and 5 is greater than for layers 7 and 8. These values are 9.4 and 5.4 units,
respectively. Thus, the conclusion made on the basis of the analysis of the
permittivity and center frequency sections that the layers of part 2 are closer
in their properties to the layers of part 3 than to the layers of part 1 (see
Fig. 14) is confirmed.
Attribute Values Within Layer 3
Fig. 18
shows a graph of the variation of the average values of the Q-factor attribute
within layer 3 laterally.

Fig. 18
The graph shows the wavelike
character of the Q-factor attribute change, the highest
values of the attribute are at pickets 30.8 and 75.3 m from the beginning of
the LPR profile. The same pickets have the lowest permittivity values and the
highest center frequency values - see shown in Fig. 19 and Fig. 20 similar
plots for permittivity and center frequency.

Рис. 19

Рис. 20
The wavelike character of the change in attribute
values in layer 3 is due to the wavelike character of changes in the
characteristics of the substance filling of the layer 3. This may be due to the
pulsating nature of the volcanic eruption, during which layer 3 was formed. If
we adhere to the assumption that layer 3 is a lava tube filled with water ice,
then the above graphs may reflect the concentration of pure ice in a lava tube.
Thus, the lower the dielectric constant and the higher the central frequency
and Q-factor, the more ice without impurities is contained in the lava tube.
Based on this assumption, we can say that at pickets of 30.8 and 75.3 m from
the beginning of the LPR profile, the concentration of pure ice is maximum.
Conclusions
As a result
of processing the LPR profiling data presented in this publication, the
following structural features of the lunar soil were identified:
1. The
lunar soil in the investigated range of depths consists of 11 layers, each of
which differs to one degree or another in its electrophysical characteristics
from other layers. The greater the difference in the average values of a layer
attribute, the more the layers differ from each other. The layout of the
layers, numbered in ascending order of the depth of the layers, is shown in
Fig. 21.
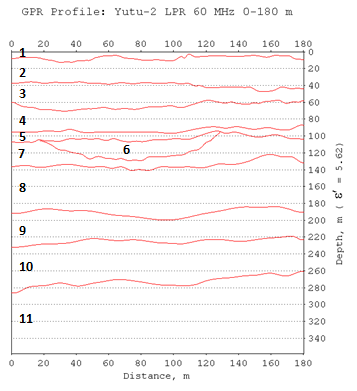
Fig. 21
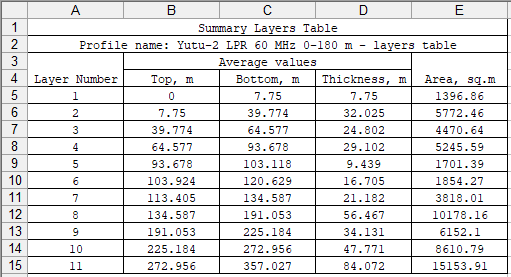
The average values of the position of the
boundaries of the lunar soil layers, their thickness and the area occupied in
the section are shown in tab. 4.
Tab. 4
2. Revealed
patterns of change in attribute values with increasing depth. This is an
increase in the values of permittivity and Q-factor, and a decrease in the
values of the center frequency. These patterns are not valid for layer 3.
3.
Layer 3 has the lowest permittivity and highest frequency and Q-factor. In tab.
5 shows the minimum, maximum and average values of the position of the top and
bottom of layer 3 in depth in meters, as well as the thickness of the layer.

Tab. 5
The fact
that for layer 3 the patterns of the change in attribute values with increasing
depth is not fulfilled indicates that this layer does not belong in composition
to the main lunar soils - basalts or regolith. Given the low permittivity, it
is assumed that this layer is a lava tube filled with water ice. A lunar base
can be placed inside such a lava tube, which will be reliably sheltered from
the effects of cosmic radiation, the ingress of solid particles from space and
temperature changes. The presence of water ice in the lava tube will help solve
the problem of life support for the lunar base.
4. At
a depth of about 100 m, a bowl-shaped layer was discovered that resembles a
depression resulting from the impact of a celestial body colliding with the
lunar surface. On the layer diagram, this layer is assigned the number 6. In
tab. 6 shows the minimum, maximum and average values of the position of the top
and bottom of layer 6 in depth in meters, as well as the thickness of the
layer.

Tab. 6
Layer 6 is
located inside layer 7, the tops of layers 6 and 7 are at the same level. If we
assume that layer 6 was formed as a result of the impact of a celestial body,
then we can conclude that the upper boundary of layers 6 and 7 was the surface
of the Moon for a long time. Over time, as a result of the bombardment of this
surface with solid particles and the impact of cosmic radiation, a layer of
regolith about 10 meters thick was formed on the surface. This layer is
numbered 5 on the layer diagram. Further, as a result of the eruption, this
surface was covered with layers of volcanic ejecta about 100 meters thick.
5. The
application of the GPR method to study the structure of the lunar soil made it
possible to obtain unique data in good resolution. An important task is to extract
from this data as much useful information as possible. The classical approach
to processing GPR data, which consists in clearing useful signals from
interference, identifying layer boundaries and determining the permittivity
from diffracted reflections, does not provide all the completeness of
information about the subsurface environment. Based on the LPR data processing
results presented in this publication, it can be concluded that the algorithms
and methods implemented in the GEORADAR-EXPERT software system sufficiently
cope with the task of increasing the information content of GPR research.
The ability
to obtain a visual representation about the subsurface environment
structure and its features in the form
of attribute sections, statistical tables and graphs determines the further use
of the GEORADAR-EXPERT software system for processing the results of GPR
profiling not only of the Moon, but also of Mars, on the surface of which it
arrived in May 2021 Chinese rover Chzhuzhong, equipped with a GPR.
…
An archive
containing section images and spreadsheets used in this publication, as well as
the result of exporting the processed LPR profile in ASCII format, can be
downloaded from the following link: https://gpr-soft.com/download/ge_lpr_original.zip