The graphical user interface in 3D visualization mode and the capabilities of this mode have been updated. The following changes and additions have been made to the software system:
Now the 3D assembly can be created not only on the basis of straight-line GPR profiles, for which the coordinates of only the start and end points of the profile are known, but also on the basis of GPR profiles of an arbitrary trajectory, and taking into account the terrain correction. The position coordinates of the GPR traces can be obtained using GPS, using this device in the process of GPR research.
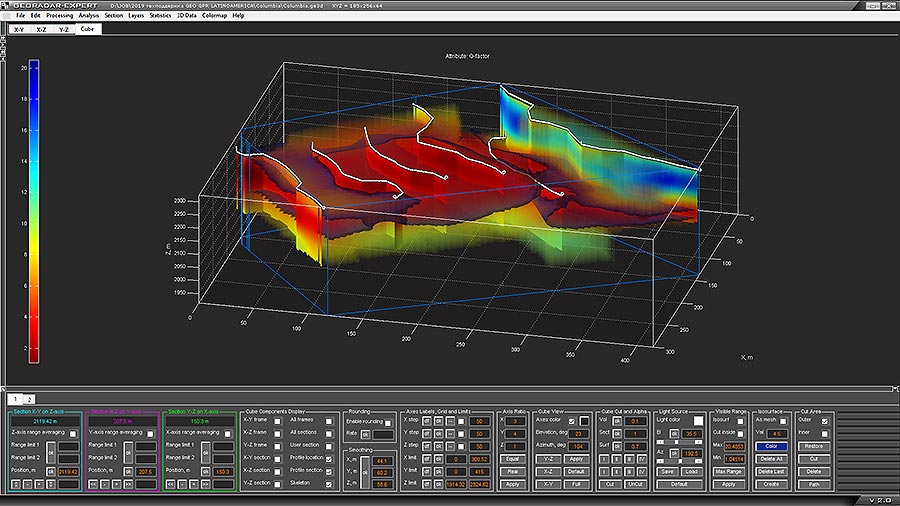
The figure below shows a 3D assembly created taking into account the coordinates of the global positioning system GPS. On the 3D view shows the position of the GPR profiles and vertical sections along these profiles. An isosurface passes through the 3D assembly volume, showing the contact position of soils with various electrophysical characteristics.
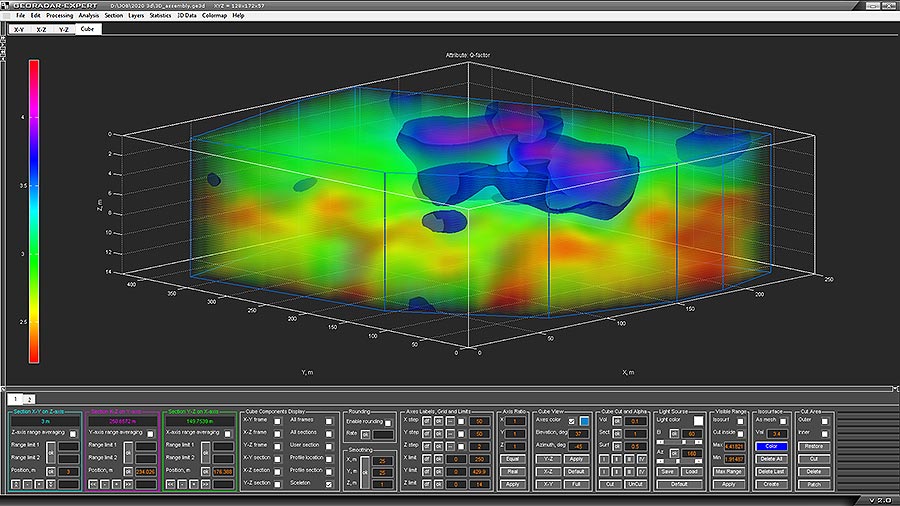
For each group of elements that make up 3D visualization, such as isosurfaces, orthogonal and custom slices, as well as the volume of 3D assembly, the ability to set different transparency levels separately has been added. This allows for greater visibility in the presentation of the results of the GPR study.The figure below shows an example of 3D visualization, which includes isosurfaces and the volume of 3D assemblies with varying degrees of transparency. In the translucent volume of the 3D assembly, interstratified layers of rocks are visible in the form of areas of red shades. The boundaries of soil anomalies are represented by isosurfaces of blue color. Translucent isosurfaces do not overlap each other, and this allows us to observe the shape of these anomalies completely.
Previously, the orthogonal section was the result of cutting a 3D volume at a given point on the axis of a 3D assembly. The plane of this section passed perpendicular to the axis through this point. Now added the ability to set two points on this axis, thus defining the boundaries of a certain thickness. In this case, the orthogonal section will be the result of averaging the given thickness. The figure below shows a 3D assembly in the form of orthogonal sections in the mode of thickness averaging. In this mode, on each axis, you can observe three frames of the corresponding color. The extreme frames indicate the position of the boundaries of the thickness for averaging, the frame in the middle is the frame of the orthogonal section, which displays the result of averaging. In this example, the X-Y section is the result of averaging the range from 1 to 2 meters along the vertical Z axis, the X-Z section is the averaging of the range from 200 to 300 m along the horizontal Y axis, the Y-Z section is the averaging of the range 150 - 200 m along the horizontal X axis.
Previously, the axes of the 3D assembly did not have a background color - i.e. were transparent. The ability to assign colors allows you to improve data visualization. Depending on the selected color scheme, you can choose a background color so that 3D assembly elements are not lost against the general background. This is especially true for the volume of 3D assembly in the translucent mode. For dark color schemes, a light background is well suited, for light color schemes - a dark background. The figure below shows an example of what a translucent array of 3D assembly looks like with a dark color scheme for different background colors. For the image on the left, the transparent color of the axes is set.
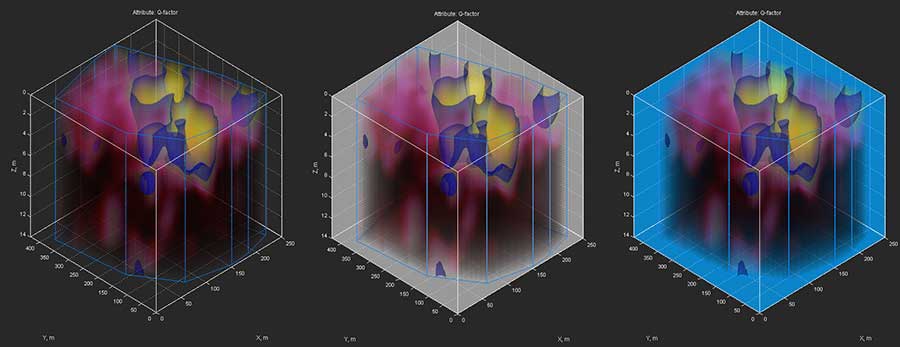
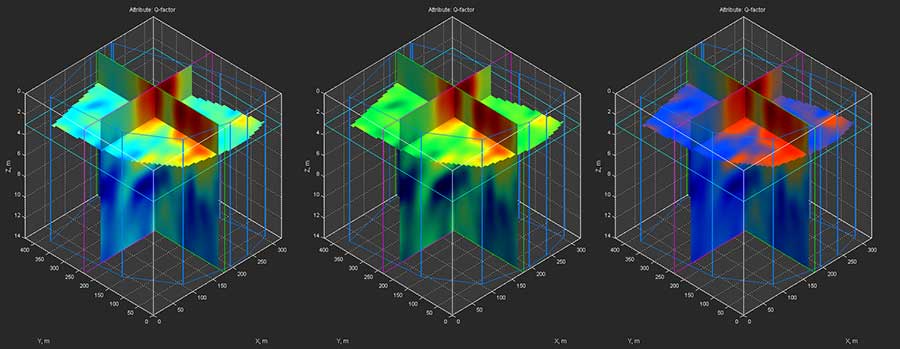
The ability to change the color of the light source allows you to quickly adjust the color balance of 3D volume elements in a three-dimensional view without changing the color map of the 3D assembly. The figure below shows the 3D assembly with white illumination, the middle figure with yellow lighting, and with red lighting on the right.
Saving the values of the position of the axes and the light source of the 3D assembly on the volume visualization tab to the file allows the user to quickly configure the desired view of 3D assembly during after its subsequent downloads.
In order to increase usability, the user interface in 3D mode has been significantly redesigned. In connection with the implementation of new 3D visualization features, new controls have been added; separate panels with advanced settings have been created for the light source and for the contour mode of 3D assembly. In general, working with 3D assembly has become more convenient.