The GEORADAR-EXPERT software system contains a fairly wide range of attributes for various GPR survey purposes. There are frequent cases when information about the object under study is not contained in full by one section of the attribute, but is distributed over the sections of several attributes. In this case, the summation of a set of attributes representing various physical aspects of the object under study allows you to combine disparate information about this object within a single summation section. At the same time, as a result of summation, artifacts caused by the accumulation of errors in the process of collecting and processing GPR information are eliminated. Below are image of the GPR profile obtained during the study of the buried valley, a set of sections of attributes for summation obtained as a result of the automated BSEF analysis of this GPR profile and the result of summing these sections.
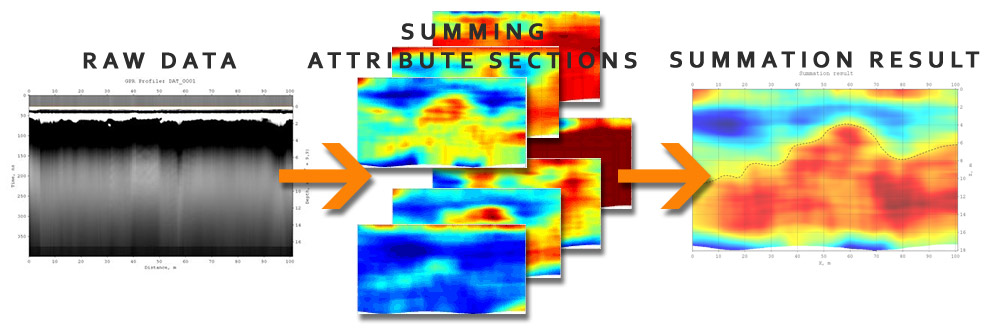
The considered GPR profile is not very informative at depths of more than two meters, and the depth of the buried valley, according to a priori information, exceeds this value. On the sections of the attributes, some details of the buried relief are noticeable; however, each of the sections separately does not provide complete information about the structure of the studied subsurface environment. The summation operation made it possible to bring these disparate useful signals into one whole. The relief of the buried valley in the total section is well traced along its entire length. In the figure, the relief of the valley is marked with a dotted line. This example shows how the use of the summation module made it possible to effectively solve the problem of insufficient information content of the GPR profile and individual sections of attributes along this profile.
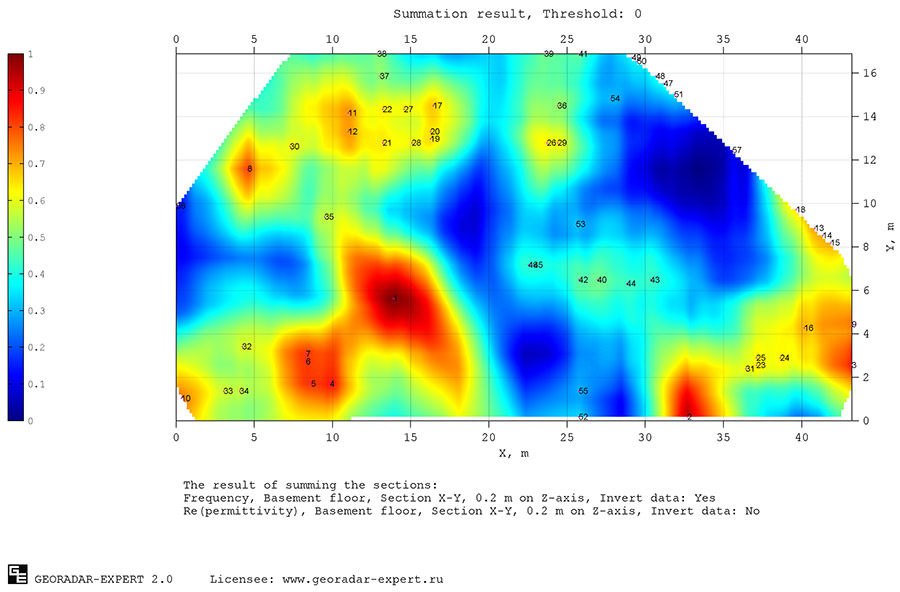
In addition to summing data, the Summation module implements the function of detecting local maxima on the summation elements and the summation result. This opportunity finds application in the tasks of detecting and defects in building or road structures, as well as for searching for local subsurface objects of various nature.
Latent defects, like local objects, are areas of the subsurface space that differ in their electrophysical characteristics from the strata enclosing them. Such areas are manifested by characteristic deviations of attribute values on section or cross-section of a 3D assembly. These deviations can be of varying intensity. The strongest deviation corresponds to the strongest manifestation of a defect or the position of a large local object. Using the function of detecting local maxima, the user quickly obtains marks of the position of local maxima using markers on the image of the summation element or the summation result, as well as a list of coordinates of these markers with the values of local maxima.
The figure below shows the result of summing the horizontal sections of 3D assemblies created from the frequency and permittivity attribute sections. The data was obtained in the course of work on non-destructive quality control of the concrete floor of the basement. The list of the summed attributes is placed under the summtion section image. Local maxima are numbered in decreasing order of values. With this numbering, the local maximum with the highest value is assigned the number 1. This numbering makes it easier for the user to visually assess the size of the local object or the degree of defect manifestation on the section.
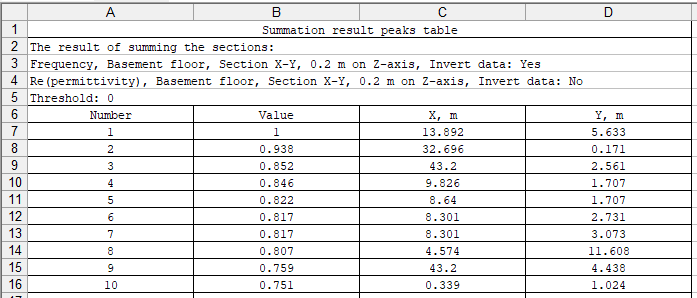
The list of coordinates of local maxima and their values can be saved in the MS Excel spreadsheet format. In this table, local maximums are also presented in descending order:
Video lessons on using the Summation module can be watched and downloaded from the video tutorials page:
Added 4 new attributes. The list of attributes is shown below. The use of the first three attributes can improve the quality of non-destructive testing of concrete building structures. The fourth attribute gives a visual representation of the change in frequencies in the section relative to the frequency selected by the user.
1. Concrete moisture content. Measured in %. Calculated by the formulas given in [Jin X, Ali M. Simple empirical formulas to estimate the dielectric constant and conductivity of concrete. Mierow Opt Technol Lett. 2019;61:386-390.];
2. Concrete conductivity – specific electrical conductivity of concrete. Measured in S/m. Calculated by the formulas given in [Jin X, Ali M. Simple empirical formulas to estimate the dielectric constant and conductivity of concrete. Mierow Opt Technol Lett. 2019;61:386-390.];
3. Concrete resistivity – specific electrical resistance of concrete. Measured in Ohm/m. Calculated by the formulas given in [Jin X, Ali M. Simple empirical formulas to estimate the dielectric constant and conductivity of concrete. Mierow Opt Technol Lett. 2019;61:386-390.];
4. Frequency interval - the number of octaves from the given frequency, for example, from the center frequency of the GPR antenna, to the frequency on the section. Measured in MHz.
If one or more additional monitors are connected to the computer, then immediately after starting the GEORADAR-EXPERT software, a monitor selection panel will open on the primary display screen for placing the GEORADAR-EXPERT working window with a list of available monitors:

This option helps to more efficiently use the multi-monitor workstation of the user in the conditions of numerous simultaneously open software. The compatibility of elements of the graphical user interface of the GEORADAR-EXPERT software with different monitor resolutions has also been improved.