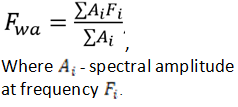
The Weighted average frequency attribute is calculated using the formula:
Waveform geophysics uses an attribute called 'quality factor', which is referred to as Q or Q-factor. Using this attribute, one can evaluate the resonance properties of areas of the subsurface environment by the characteristics of waves reflected from these areas. Calculation of the Q-factor attribute can be performed in different ways, giving different absolute values but, in general, equally characterizing the studied environment and the propagation of waves in this environment. Previously, in the GEORADAR-EXPERT software system, the Q-factor attribute is calculated in one way - as the ratio of the center frequency of the reflected signal spectrum to the width of this spectrum.
Now we have added the ability to calculate the Q-factor attribute taking into account the spectral shift using the following formula:
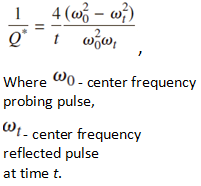
Formula published in John H. Bradford. Frequency-dependent attenuation
analysis of ground-penetrating radar data. GEOPHYSICS,VOL. 72, NO. 3 MAY-JUNE
2007; P.J7–J16. The authors of the publication note that the
anomalous deviations of the attribute calculated by this method are an
indicator of the presence of light liquid organic pollutants of the non-aqueous
phase (LNAPL) in the soil, such as oil, benzene and similar substances. In GEORADAR-EXPERT, the attribute calculated in this way is denoted as Q-factor by F-shift.
In addition, another way to calculate the Q-factor attribute has been added - as the ratio of the weighted average frequency of the reflected signal spectrum to the width of this spectrum at the center frequency. In GEORADAR-EXPERT, the attribute calculated in this way is denoted as Q-factor by weighted average frequency.
The user has the ability to set one or more rectangular areas on the section so that during the subsequent calculation of the section, the data of the BSEF analysis points, the coordinates of which are inside these areas, were not used. With this feature, for example, you can remove edge effects on a section. The figure below shows a section before (left) and after deleting user-defined areas. Data deletion areas on the section are displayed as black and white frames.
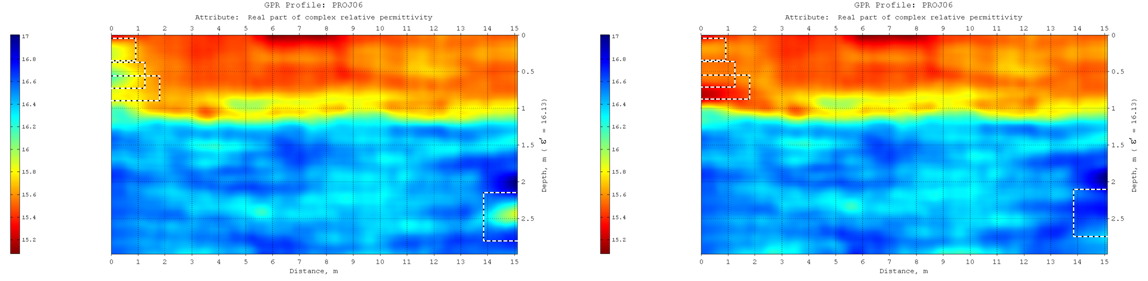
For more details about working with this option, see the chapter Ignoring User-Specified Data Part for Section Creating of the GEORADAR-EXPERT user manual.
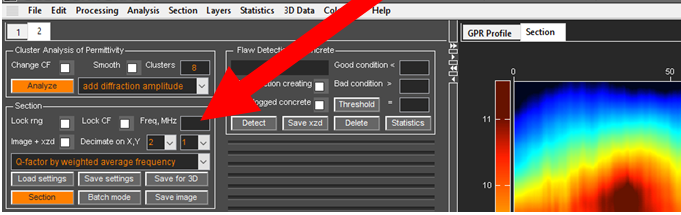
The change is in the Section panel located in the left group of tabs. A window for entering the Freq value for calculating attributes with Q-factor by F-shift and Frequency interval has been added to the Section panel. The value is entered in MHz. If the input window is empty, then in the course of calculating the specified attributes, the maximum frequency value from the BSEF analysis results is automatically selected. The figure below shows the location of this input window.
In the GEORADAR-EXPERT software system, the corrective
function minimizes the influence of possible errors in the automated BSEF
analysis on the reliability of the section. The corrective function is the main
data optimization tool for creating a section. Along with the corrective
function, there is a tool for additional optimization of BSEF analysis results,
which is not used in all cases. Additional data optimization shows the greatest
efficiency for a horizontally layered subsurface. For example, for GPR profiles
obtained as a result of the survey of building structures or road pavements.
As an
example, the figure below shows the GPR profile obtained during the study of a
reinforced concrete slab with a thickness of about 0.2 m, which lies on a sand
layer with a thickness of about 0.2 m. Below the
image of the GPR profile, sections of the Concrete
moisture content attribute are shown, calculated without performing
additional data optimization (left) and using additional data optimization.
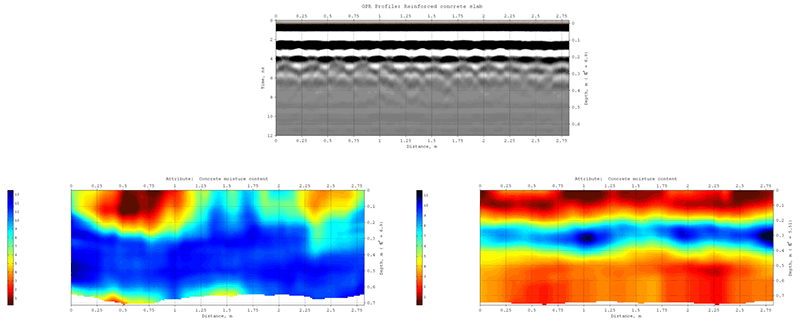
The section, which was created using additional data optimization, clearly shows the slab layer and the distribution of moisture within this layer, as well as a more humid layer of sand that acts as a drain. The section calculated without additional data optimization shows a less accurate model of the studied subsurface. The reason for this is the partial shielding of the GPR pulses by metal bars of reinforcement, as well as the overlapping of reflections from these bars, which generate a measurement error during the automated BSEF analysis.
The controls for additional data optimization are located in the Additional Data Optimization pane, which opens in the left tab group when loading an efd file with automated BSEF analysis results. For more information on additional data optimization see the chapter Additional Optimization of BSEF Analysis Results in the GEORADAR-EXPERT user manual.
If the GPR profile contains many diffracted reflections from local objects, then such a replacement can correct some errors in the BSEF analysis associated with determining the frequency of reflected signals, if any, and increase the reliability of the result of calculating the section of the real part of the complex relative permittivity Re (permittivity). The figures below show histograms of frequency distribution, plots of the corrective function and Re (permittivity) sections, each of which was created using the corresponding corrective function before changing the center frequency to the weighted average frequency (upper figure) and after such replacement (lower figure).
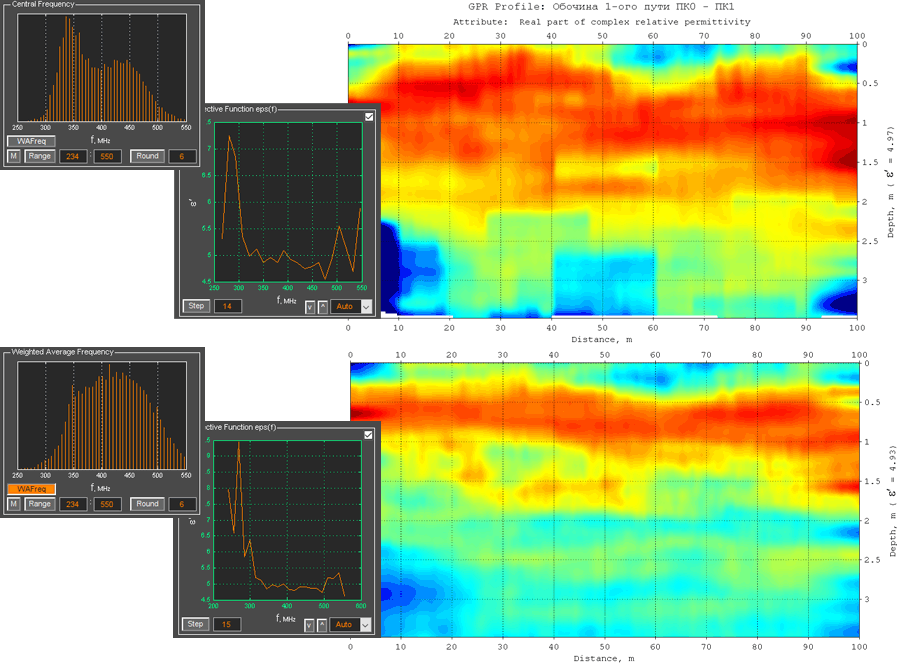
For the GPR profile, according to the BSEF analysis results
of which the above sections were created, the section in the lower figure,
calculated using the weighted average frequency, more accurately reflects the
structure of the object under study, which is the ballast prism of the railway
track. There are no unequivocal recommendations for replacing the center
frequency with a weighted average frequency. Decisions on such a replacement
should be based on a priori information about the object under study, which
should be used when comparing the fidelity of the sections created using
corrective functions calculated on the basis of both the center frequency and
the weighted average frequency.
For more details about working with this option, see the chapter Center Frequency Replacing with Weighted Average Frequency for CF Calculating in the GEORADAR-EXPERT user manual.
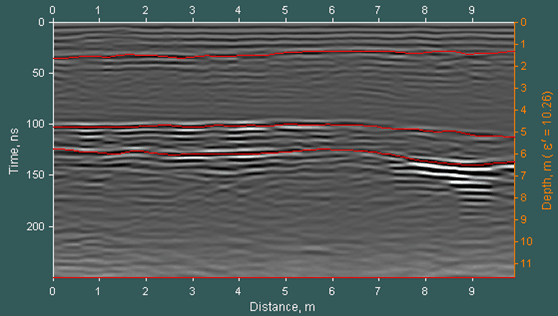
The user can manually create layer boundaries not only on the GPR profile, but also on the attribute section or 3D assembly cross-sections. In this case, various visualization options for layers are available. It can be a single color fill of a layer, where the fill color will be determined by the maximum, minimum or average value of an attribute within this layer. Or the specified values will be calculated for each column of the numerical matrix of the section within the boundaries of the layer. Visualization conditions can be selected for each layer separately, or for all layers at once. Layer visualization is configured using the controls located in the pop-up window. For more details about working with this option, see the chapter Setting Layers Visualization on Section of the GEORADAR-EXPERT user manual.
As an example, the figure below shows a GPR profile with drawn layer boundaries and the result of exporting the data of the upper layer with a step of 0.5 m, a summary table by layers from the Summary tab and a map of the layers' location, which is saved to a graphic file. For more information about exporting layers on a GPR profile, section or cross-section of a 3D assembly, see the Exporting Layer Boundaries to MS Excel chapter of the GEORADAR-EXPERT user manual.
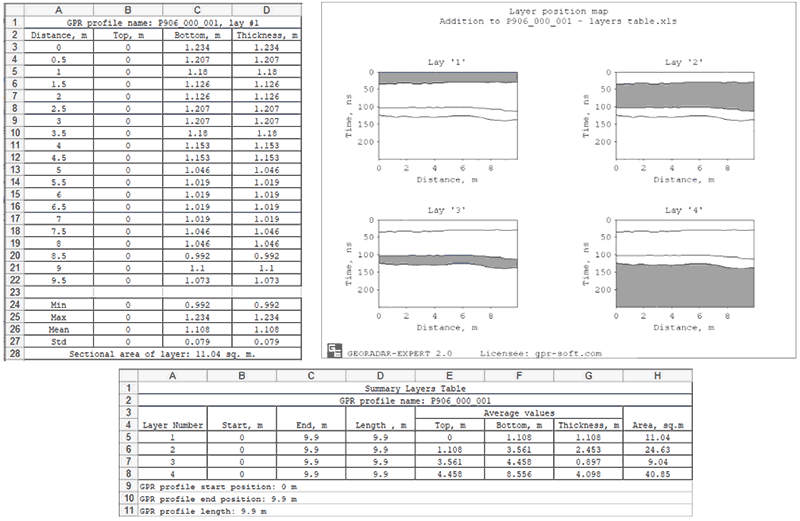
A layer map consists of a set of subsurface thumbnail with layer boundaries drawn. Above each thumbnail is a layer number, which is automatically assigned in ascending order of the average depth of the layer. The layer numbers on the layer map correspond to the layer numbers in the table. The layer, the number of which is indicated in the header of the subsurface thumbnail, is highlighted in this image with a gray fill. The sheet of the map of the location of layers is adapted for insertion into a document in MS WORD format A4 in portrait orientation. Up to 8 subsurface thumbnails can be placed on one sheet. If the subsurface thumbnails do not fit on one sheet, additional sheets are automatically created during saving in the required quantity.
For the statistics module, the way of selecting a layer in the Layer Picker for Statistics window has changed. Now this is done not by clicking on the layer image, but using the context menu that appears when the mouse pointer is over the layer and the right mouse button is clicked. Also, using the context menu, you can focus the layer selection window on the upper, lower or middle part of the section. This feature is convenient to use when the boundaries of the layers, concentrated in any part of the section, are located close to each other. For example, the boundaries of the asphalt pavement layers in the upper part of the section. For details, see the chapter Using the Layer Picking Panel in the GEORADAR-EXPERT user manual.