The purpose of the GPR survey, the results of which are presented in
this publication, is to clarify the structure of the subsurface medium
along the highway that crosses one of the small Moscow rivers. This
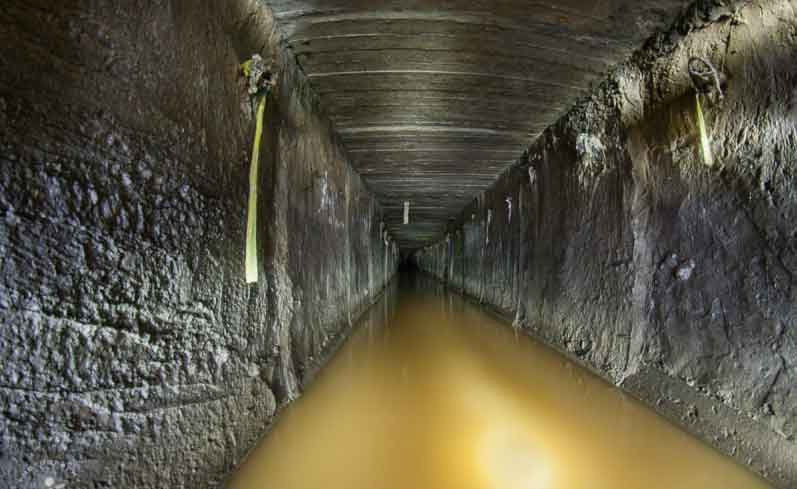
river flows underground, enclosed in a reinforced concrete collector -
see photo below.
GPR profiling was performed by a 25 MHz antenna. The choice of such a
low-frequency antenna is due to the requirement of the technical
specifications to ensure the depth of GPR research up to two tens of
meters. Such low-frequency antennas are quite large in size and for this
reason shielding from interference for such antennas is not
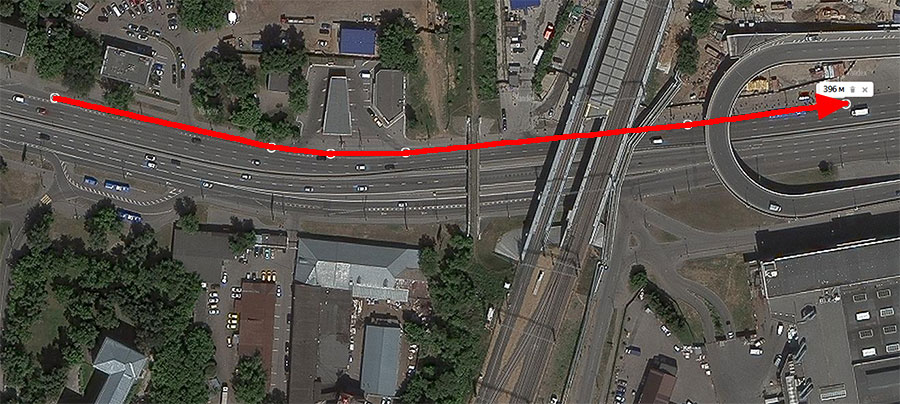
structurally provided. The figure below shows a satellite image in which
the red line shows the position of the GPR profile.
The figure below shows the raw data of GPR profiling.
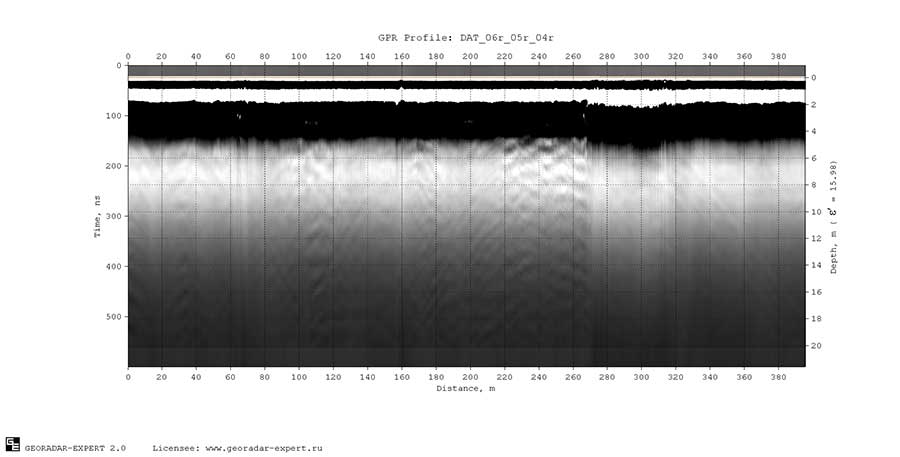
Since the GPR antenna was not shielded from interference, the wave
pattern of the GPR profile contains numerous reflections from
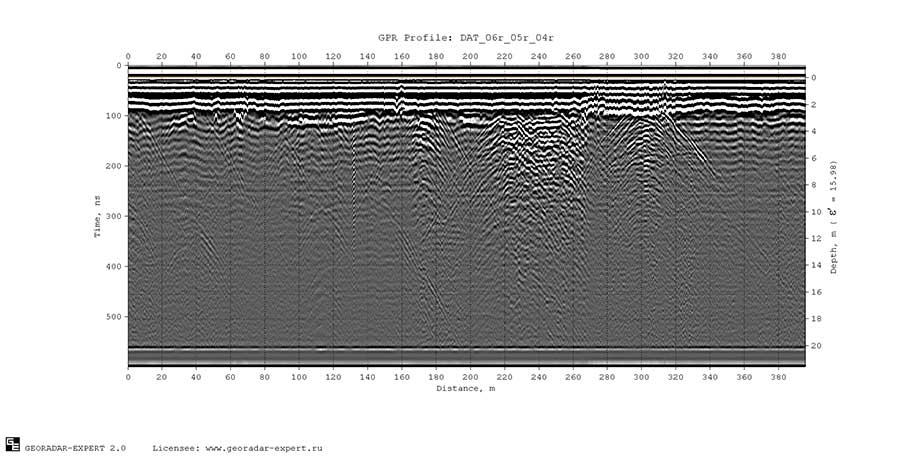
ground-based objects of road infrastructure. The figure below shows the
GPR profile after applying digital signal processing methods to increase
resolution and improve visualization of GPR data. As a result of
processing, the information content increased slightly, it became
possible to observe the boundary between the primary and bulk soil at a
depth of about 2 m, but still, this is not enough to achieve the purpose
of this GPR survey.
In such cases, the informational content of the GPR
research can be increased by the transition from the presentation of
data on the subsurface medium in the form of a set of amplitudes of
reflected signals in the form of a radarogram to the set of
characteristics of the subsurface medium or wave field reflected by this
medium, which is presented in the form of an attribute section. For
this purpose, the GEORADAR-EXPERT software implements an automated
analysis of the BSEF (Back-Scattering Electromagnetic Field).
The choice of the section attribute is
determined by the soil conditions and the purpose of the GPR survey. The
most commonly used attribute is the real part of the complex relative
permittivity (hereinafter - permittivity). The permittivity value shows
how many times the speed of propagation of an electromagnetic wave in a
medium is less than in a vacuum. Based on permittivity values, soil
moisture can be calculated, for example, using the Topp formula [Topp,
G.C., Davis, J.L., and Annan, A.P., 1980, Electromagnetic determination
of soil water content: measurements in coaxial transmission lines: Water
Resour. Res., V. 16, p. 574-582.] But sometimes it happens that the
permittivity section cannot fully provide information about the
structure of the subsurface medium. As an example of such a case, the
figure below shows a permittivity section for the GPR profile under
consideration.
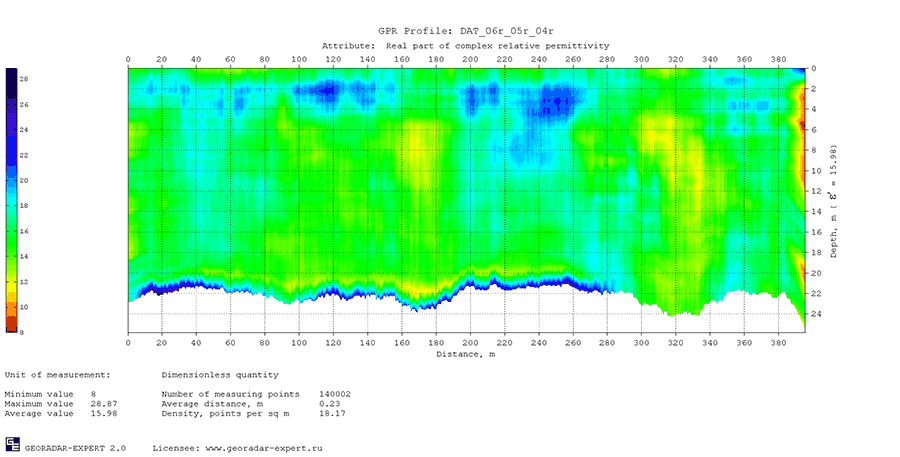
The reasons for the low informativeness of the
permittivity section can be high attenuation of the GPR pulse in the
medium, antenna mismatch with the medium, under which the power of the
emitted GPR pulse is noticeably reduced, and also the interpenetration
of materials of the neighboring layers. In the case of interpenetration,
the boundary between layers is blurred, there is no sharp change in the
dielectric constant at such a boundary, which is necessary for the
formation of the reflected wave.
In such conditions, to study the structure of
the subsurface medium, it is effective to use frequency attributes - for
example, the center frequency of the spectrum of the reflected GPR
pulse. The layers of different composition and degrees of humidity have
different effects on the amplitude-frequency characteristic of the GPR
probe pulse passing through these layers - i.e. each layer of the
subsurface medium can be considered as a frequency filter with its own
passband. Frequency attributes are quite sensitive to changes in the
electrophysical characteristics of subsurface layers. The area of a
section of a frequency attribute that has close values of the attribute
can be interpreted as a layer.
The figure below shows a section of the
attribute 'Central frequency of the spectrum of reflected signals',
which was created according to the results of an automated BSEF analysis
by the GEORADAR-EXPERT software and interpretation of this section.
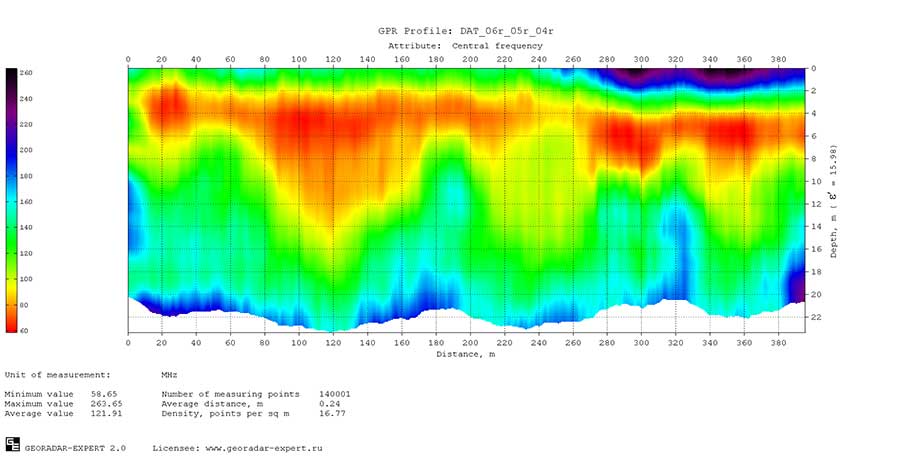
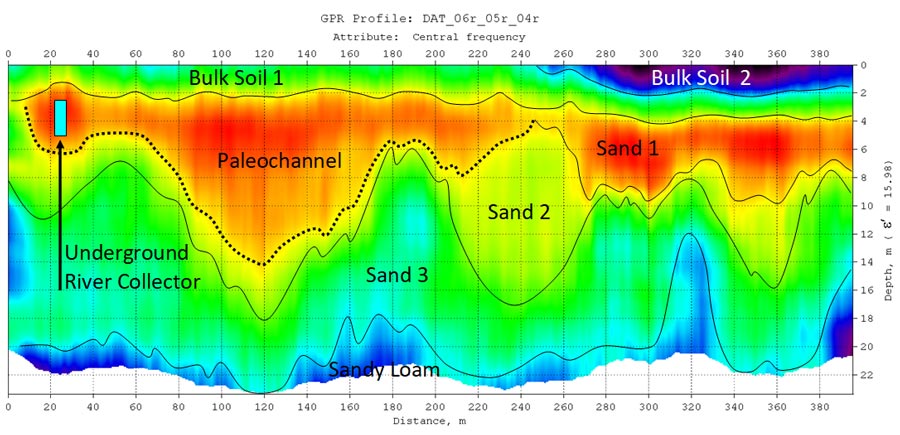
In contrast to the permittivity section, the
paleorelief is clearly visible in the frequency section. A significant
part of the paleo-relief is a buried paleochannel of the river. The
bottom of the paleochannel in the section is indicated by a dashed line.
The blue rectangle in the section shows the approximate position of the
underground river collector. Information about the location of the
river collector was taken from archival sources. To more accurately
determine the position of the central axis of the collector, you can use
the graph of average frequency values for the frequency section under
consideration created in the statistical analysis module of the
GEORADAR-EXPERT software.
The statistical analysis module is intended to
summarize the results of GPR profiling and to visualize the variability
of GPR data. Using the results of statistical analysis, presented in the
form of tables and graphs, it is possible to establish a relationship
between the physicomechanical characteristics of the medium under study
(for example, soil or building structures) and various statistical
indicators, thus forming a set of features that can be used in the
future for assessment of the condition of similar objects.
In addition, graphs of statistical attributes
can be used to clarify the position of subsurface objects on the GPR
profile according to the position of local extrema. The figure below
shows a graph of the average frequency values for the considered
frequency section.
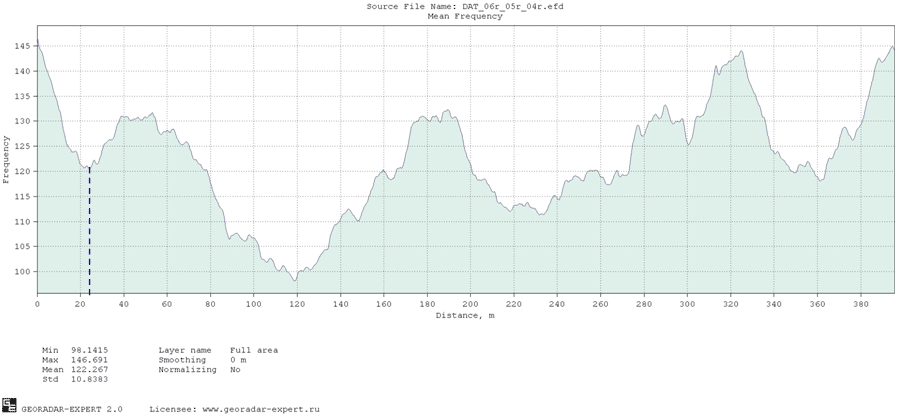
The local extremum of the graph corresponding to the position of the
central axis of the collector is located at a distance of 24.2 m from
the beginning of the GPR profile. On the graph, the position of this
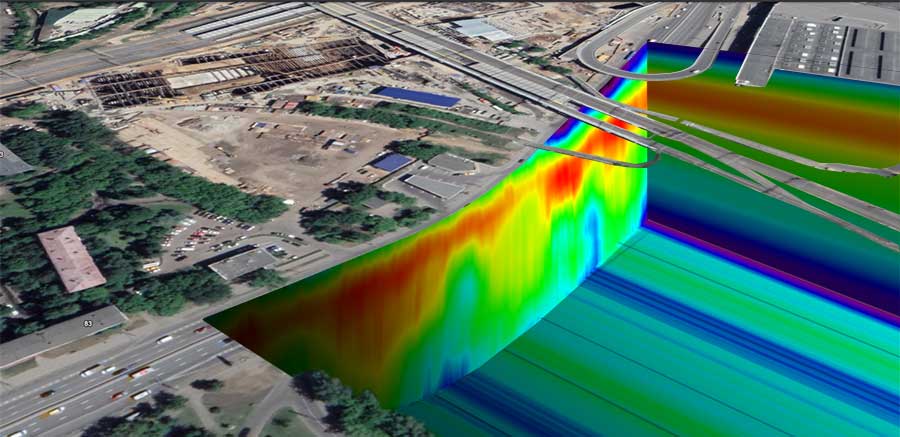
extremum is shown by a dashed line. The figure below shows the result of
superimposing the center frequency section over the satellite image of
the GPR survey area.
Using the GEORADAR-EXPERT software allowed us to successfully achieve
the purpose of GPR research and, despite the low dielectric contrast of
the section, to obtain information about the investigated subsurface
environment. Without the use of the BSEF automated analysis method, this
GPR study would have to be considered unsuccessful and resorted to more
expensive methods of geophysical studies, which also have a lower
resolution compared to the GPR method.