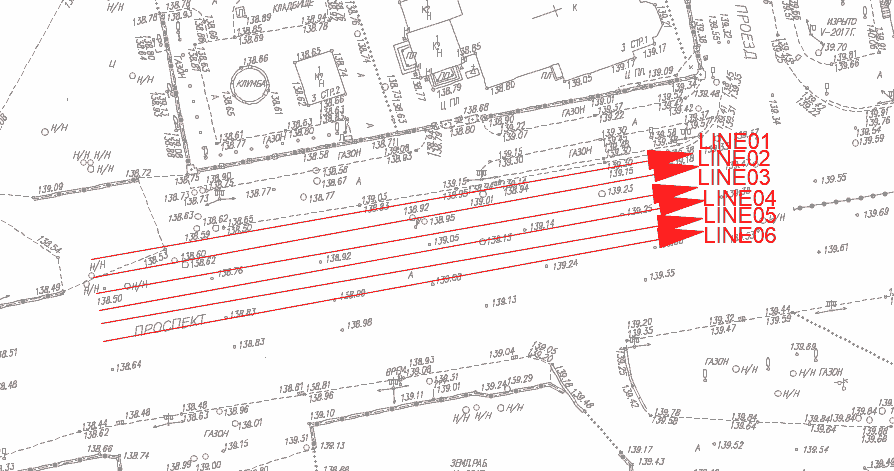
GPR survey of the roadway with high traffic intensity was carried out with a shielded 400 MHz antenna. The purpose of the survey - the detection of areas of reduced strength of the road surface. As a result of this survey, six GPR profiles were obtained, which were parallel to each other and having a direction opposite to the direction of traffic. Below is a terrain plan showing the position of the GPR profiles and images of these profiles.
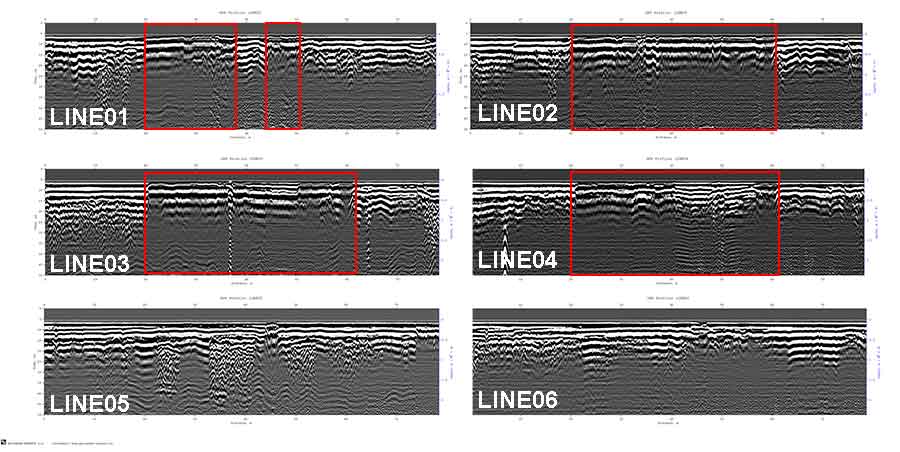
A visual analysis of the GPR profiling results showed that the LINE01-LINE04 GPR profiles have areas characterized by reduced amplitudes of the reflected signals. In the figure above, such areas are highlighted in red. On all of these profiles, the low amplitude areas starts at 20 meters from the beginning of the GPR profile. The thickness of the pavement in the area of GPR survey varies from 0.22 to 0.36 meters, with the minimum thickness occurring in areas of lower amplitudes. The lower bound of the road surface in areas of lower amplitudes is less visible.
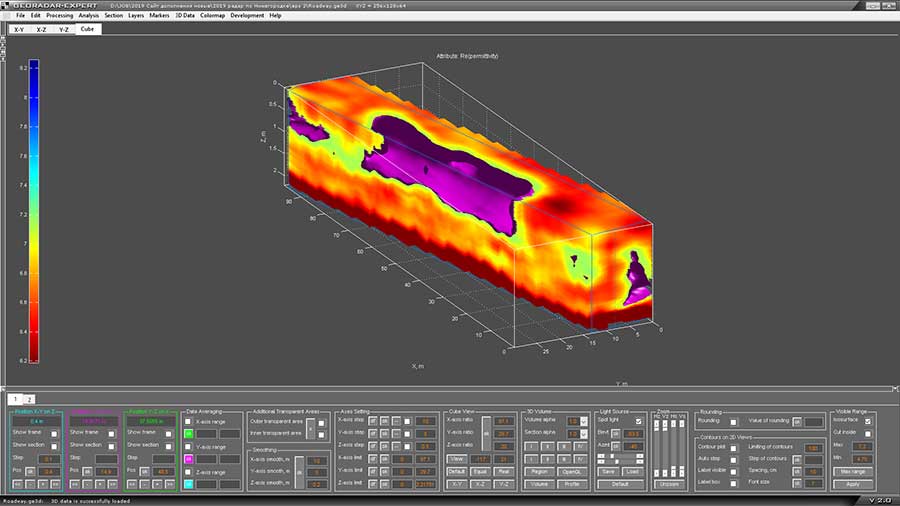
According to the results of the automated analysis of the back-scattering electromagnetic field (BSEF) of GPR profiles, sections of the following attributes have been created in the GEORADAR-EXPERT software system: the real part of the complex relative permittivity (Re (permittivity)); the central frequency of the spectrum of diffracted waves (Frequency) and the spectral flatness of the reflected signals (Spectral flatness). Based on these sections, a 3D assembly was formed by each attribute. The figure below shows the 3D assembly of the Re (permittivity) attribute sections and the orthogonal cross-sections of this assembly - a horizontal section at a depth of 0.2 meters (in the asphalt concrete) and two vertical sections.
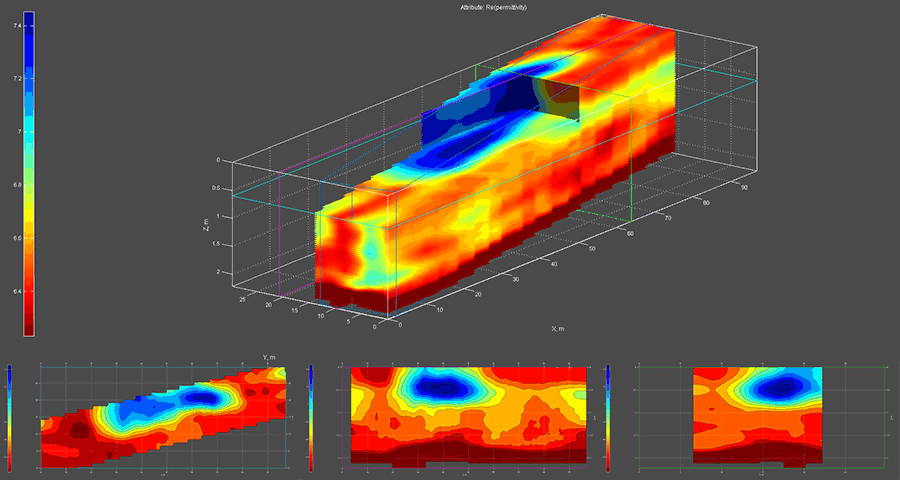
The values of the of the Re (permittivity) attribute are in the range from 6.2 to 7.5. Red color shows lower permittivity values, dark red color corresponds to the lowest attribute value. Blue color shows elevated permittivity values, dark blue color corresponds to the highest attribute value. In the volume of 3D assembly, there is a noticeable region of relatively high values of permittivity, which coincides with the zone of low amplitudes of the reflected signals on the GPR profiles. For a more detailed study of this area, a curvilinear vertical section was created that more accurately intersects the region of elevated values of the Re(permittivity) attribute. Below is shown the position of the curvilinear section on the top view of the 3D assembly and view this vertical section:

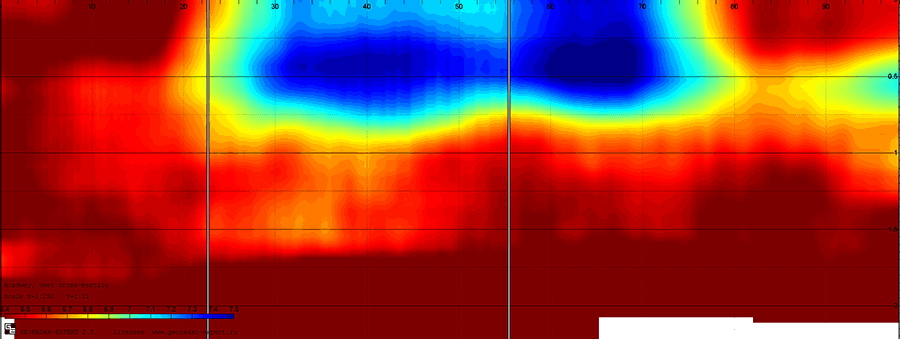
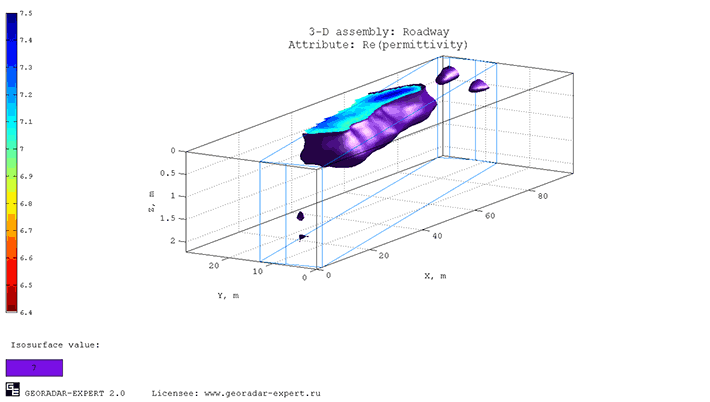
Based on the visual analysis of the section, it can be said that the area of elevated values of the Re(permittivity) attribute is present both in the base and in the thickness of the road surface. It is known that the presence of moisture in the subsurface environment has the greatest effect on the permittivity. Microcracks in the layer of asphalt concrete pavement, formed as a result of the vibration effect of moving vehicles, allow moisture from the surface to penetrate into the layers of the pavement, which causes an increase in the values of the permittivity in these layers. Microcracks and moisture reduce the strength and durability of the road structure. For this GPR survey with 400 MHz antenna, the value of Re (dielectric permeability) attribute = 7 can be assumed as the boundary between a strong and a low-strength pavement. The figure below shows the region of a 3D assembly in which the dielectric values are increased and the strength of the pavement is reduced.
The figure below shows a horizontal cross-section of a 3D assembly of the Frequency attribute (the center frequency of the spectrum of reflected GPR pulses). The line on this cross-section shows the position of the curvilinear vertical section of this 3D assembly. You can see the image of this curvilinear section under the image of the horizontal section.

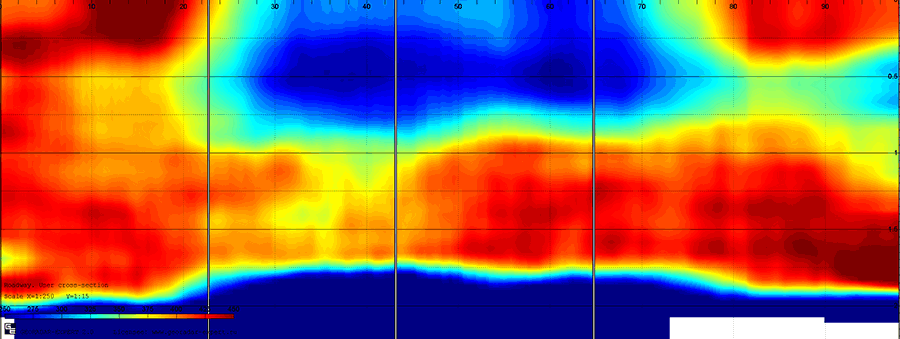
The Frequency attribute values range from 250 to 450 MHz. Low frequencies are displayed in blue, and the dark blue color corresponds to the lowest frequency at this section of 250 MHz. The high frequencies are displayed in red, and the dark red color corresponds to the highest frequency at this section of 450 MHz. You may notice that the subsurface environment model calculated from the Frequency attribute and the subsurface environment model calculated from the Re (permittivity) attribute are very similar. Considering these two models, we can conclude that a decrease in the center frequency of the reflected GPR signals corresponds to an increase in the dielectric constant values. This means that for this GPR survey, a decrease in frequency is an indicator of reduced strength of structural pavement layers. For this GPR survey with a 400 MHz antenna, the boundary value between strong road surface and low strength road surface is 375 MHz.
The figure below shows the vertical section of the 3D assembly of the Spectral flatness attribute (spectral flatness of the reflected GPR signals), whose position coincides with the position of the curvilinear section of the Frequency attribute.
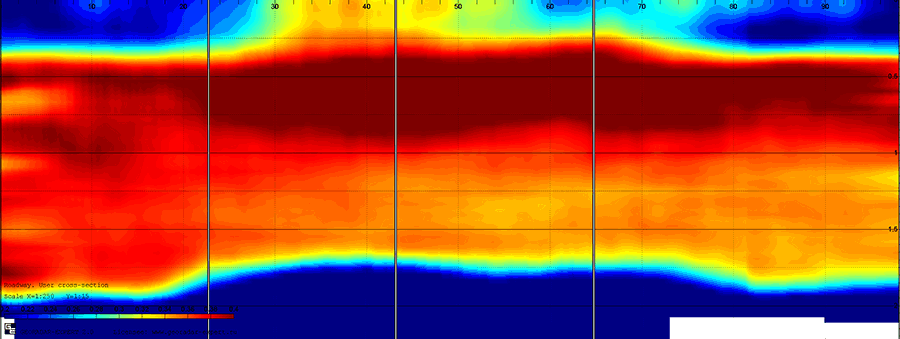
The values of the Spectral flatness attribute are an indicator of the similarity of the reflected signal of a GPR with a signal having a uniform distribution of spectral components over the entire frequency range - i.e. with white noise. The higher the value of this attribute, the higher the similarity of the signal with noise. The limit value Spectral flatness = 1 means that the signal is white noise, the pure harmonic signal has the attribute value Spectral flatness = 0. The values of the attribute Spectral flatness in this section are in the range from 0.2 to 0.4. Blue color shows reduced attribute values, dark blue color corresponds to the lowest value of 0.2. Red color shows elevated attribute values, dark red color corresponds to the highest value 0.4.
Considering this section, you can see that the attribute Spectral flatness is well suited for analyzing the state of the pavement layer (depth range from 0 to 0.22 - 0.36 m), since more accurately shows the boundary between the coating and the base. In the thickness of the base, the change in the values of the attribute Spectral flatness is weakly correlated with the change in the values of the attributes Re (permittivity) and Frequency. A visual analysis of the section shows that the elevated values of the Spectral flatness attribute correspond to the zones of non-dense in the pavement layer, and the higher the attribute value, the more microcracks in this layer and the lower the strength of the asphalt concrete. For this GPR survey with an antenna of 400 MHz, the value of the attribute Spectral flatness = 0.28 can be considered as the boundary between a good strength road surface and a low strength road surface.
The figure below shows the result of overlaying a horizontal cross-section of a 3D assembly of the Re (permittivity) attribute at a depth of 0.2 meters with a satellite image of the surveyed road.
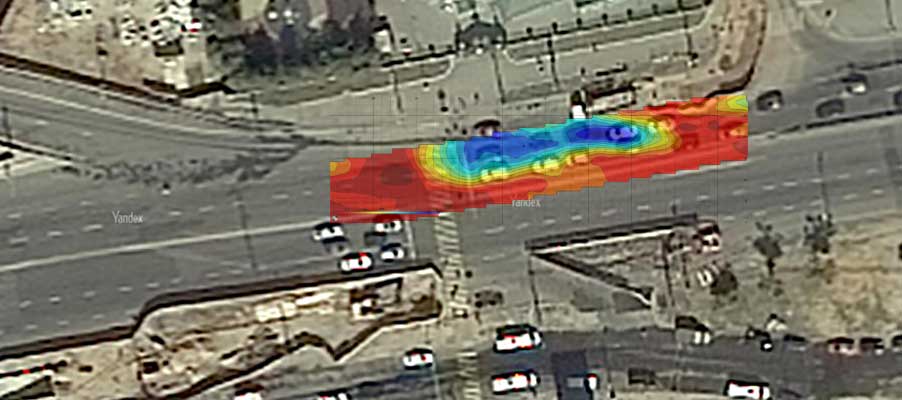
It is noticeable that the zone of elevated values of the permittivity of the section (which is a zone of low strength of the road surface and the base) begins from the zebra of pedestrian overpass. It becomes clear the most probable reason for the decrease in the strength of the road construction in this area: vehicles, slowing down the speed before a pedestrian crossing to a full stop, create an increased load on this area of the road. This also explains the fact that the length of the zone of low strength increases from the extreme right lane to the left lane. This is because the average vehicle speed in the left lane is higher than in the right lane, and drivers start to brake at a greater distance from the pedestrian crossing.
The figure below shows a view of the surveyed road section from a different point of view. This is a view from the end of the GPR profiles towards their beginning - i.e. towards the pedestrian crossing. The arrow shows the well hatch, which is located in the area of reduced strength of the road surface, which indicates the presence of underground utilities under the roadway, which, by their presence, also affect the deterioration of the strength of the road structure.
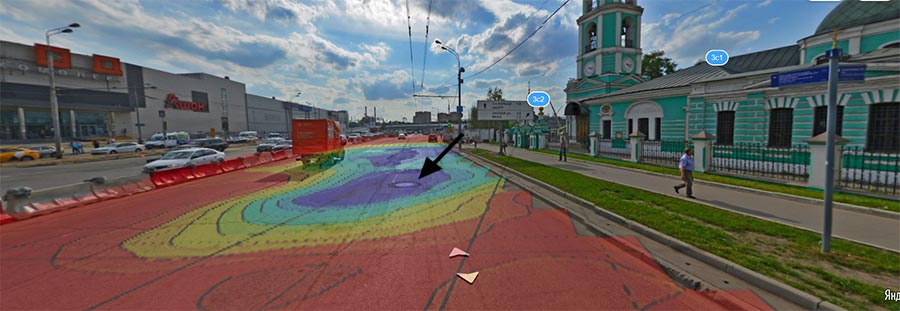
There is no doubt that the use of the software system GEORADAR-EXPERT has increased the information content and visibility of the final result of this GPR study. The use of automated analysis of the back-scattering electromagnetic field (BSEF), implemented in GEORADAR-EXPERT, made it possible to identify the relationship between the attributes of the subsurface environment and the wave field, to obtain additional criteria and to develop decisive rules for assessing the state of highways using GPR. These criteria and rules are:
The following criteria indicate the reduced density of the road surface and, as a consequence, the reduced strength of the road structure:
- Elevated values of the real part of the complex relative permittivity;
- Low values of the center frequency spectrum of the diffracted waves;
- Elevated values of the spectral flatness of the reflected signals.
For a given GPR survey, the road pavement can be considered as being in a state of reduced strength, if in this layer: - Values of the real part of the complex relative permittivity above 6.8;
- The values of the center frequency spectrum of the diffracted waves below 375 MHz;
- The values of the spectral flatness of the reflected signals above 0.28.
The above described principle of estimation of road surface condition can be used for high-quality GPR monitoring of roads and on a larger scale. To do this, on the test section of the road, whose characteristics are known, it is necessary to work out decision rules based on the boundary values of the Re (permittivity), Frequency and Spectral flatness attributes between bad and good pavement conditions and apply these rules during the monitoring of long stretches of the same type road pavement constructions in same weather conditions.
