This web page shows the use of the software system GEORADAR-EXPERT to control the quality of jet grouting results in underground mines. This is an urgent task, as in the process of underground work there can be problems caused by the presence of voids, cavities, cracks in the stabilized soil. All these defects affect the strength of the soil-cement mass.
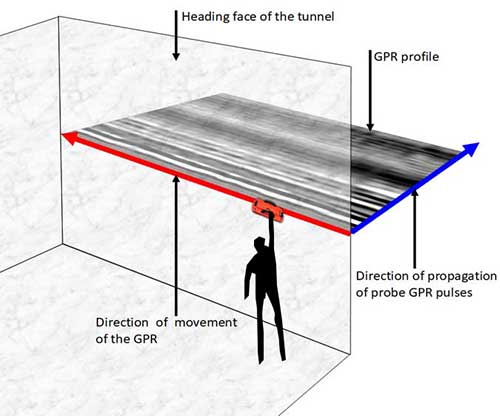
A GPR survey of the face measuring 4 by 4 meters was carried out with a 300 MHz GPR antenna. The georadar profile had a horizontal orientation and passed through the face center. Below is a scheme works in the face and the result of GPR profiling.
Raw data of GPR profiling:
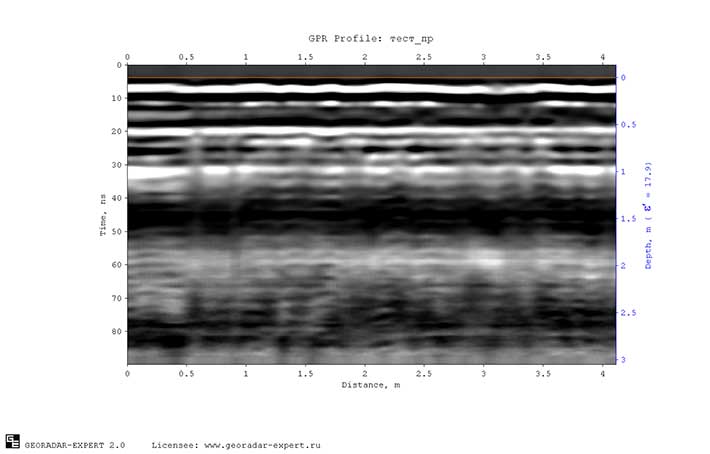
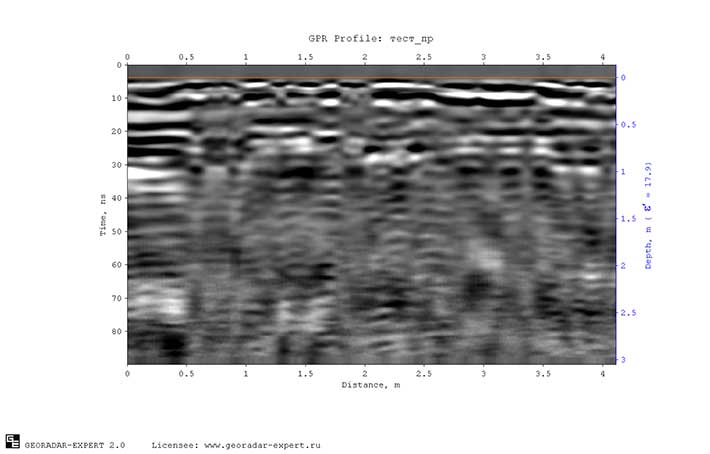
Visual analysis shows that the wave pattern of the raw GPR profile does not contain any anomalies that could be interpreted as defective areas of the stabilized soil. It is impossible to say with certainty whether such areas are missing on the GPR profile, or whether they exist, but the reflections from these areas are overlapped by more intense signals. This question does not have a definite answer also after processing the GPR profile:
The use of the software system GEORADAR-EXPERT makes it possible to detect low-intensity signal anomalies in the wave profile of the GPR profile, to determine the characteristics of these anomalies and to create a section of one or another attribute of the subsurface medium or wave field. The figure below shows the Weight Water Content section, created on the basis of the results of an automated analysis of the backscatter electromagnetic field (BSEF).
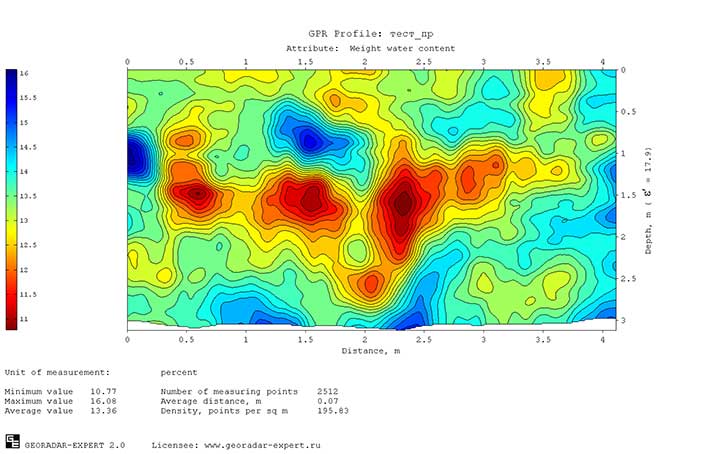
The least wet area of the section is wedge-shaped - the closer to the center of the GPR profile, the thicker this area. This is due to the position of the nozzle through which the binding solution was fed. The denser the stabilized soil, the smaller its porosity, the smaller the cracks and cavities in such a soil and the lower its moisture capacity. On this basis, the quality of soil stabilization can be assessed by the distribution of moisture in the thickness of the soil-concrete. The most humid zones indicate poor soil stabilization.
The figure below shows a section of the Q-factor attribute (the ratio of the center frequency of the spectrum of reflected signals to the width of the spectrum).
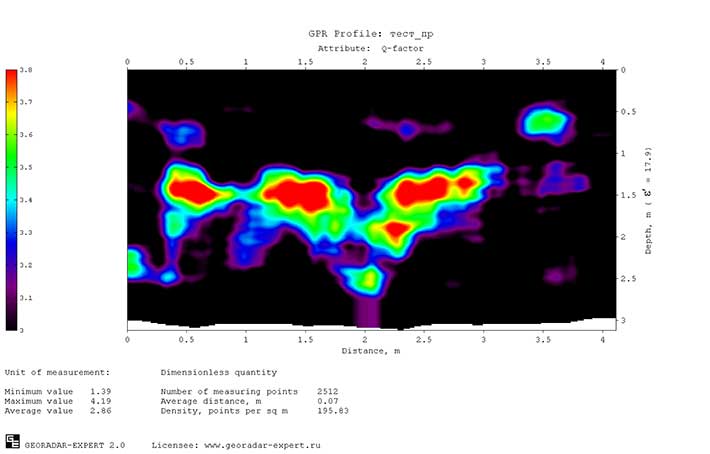
On the Q-factor section, as well as on the section of Weight Water Content, there is a wedge-shaped area that is distinguished by increased attribute values. Comparing these two sections, it can be concluded that the less dense and because of this the more wet soil-concrete is characterized by small values of the Q-factor attribute, and the dense and therefore dry soil-concrete is characterized by increased values of the Q-factor. This rule works for concretes in a wet environment. Here it is necessary to clarify that for the study of concrete in a dry state or in a state of natural moisture, the result will be the opposite: porous, fractured areas will be characterized by elevated values of the Q-factor attribute, and denser areas will be characterized by lower values of this attribute. Information about the humidity of the environment should always be considered when analyzing the sections of the Q-factor attribute.
The Q-factor in GEORADAR-EXPERT is calculated by the formula Q= Fc / Fw, where Fc is the center frequency of the reflected GPR signal, and Fc is the width of the spectrum of this reflected GPR signal.
To use the Q‐factor attribute correctly, you need to have a rough estimate of the humidity of the object. As an example, consider a building structure made of concrete. In a dry state or in a state of natural humidity of concrete, cracks and pores of this concrete structure are filled with gas (air). In this case, the increased values of the Q‐factor attribute are an indicator of the zones of accumulation of micro cracks, pores, and caverns. In these places, concrete has a low density and strength. In a highly humid state, the pores and cracks of concrete are filled with water, and in this case, the lower values of the Q‐factor attribute are an indicator of areas of low density and concrete strength (or other material - soil or rock).
As experience shows, a very rough estimate of the humidity of the medium under study is sufficient. But theoretically, in some borderline, in terms of humidity, conditions, the use of the Q‐factor attribute can give an error. In practice, the presence in the section of zones with a sharp deviation of the Q‐factor attribute values (no matter which way) signals violations of the norm of the state in the studied media. It is also possible, having information on which direction the Q‐factor deviates, to determine whether microcracks or pores are filled with gas (аir) or water.
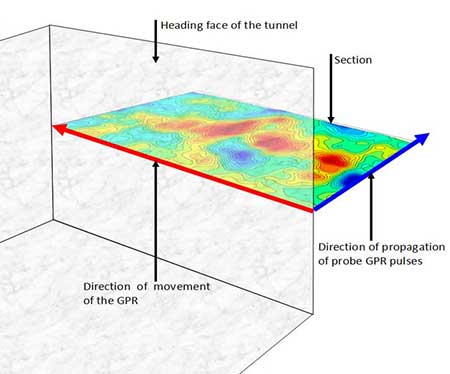
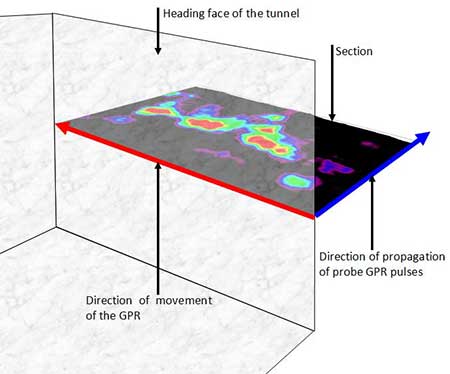
The figures below show the positions of the sections of Weight Water Content and Q-factor relative to the heading face of tunnel:
The GEORADAR-EXPERT software system can be used as an effective tool for monitoring the condition oof the lining of underground mines and near-mine space.