During the operation of engineering structures built in permafrost conditions, negative geocryological processes may occur. The resulting taliks, subsidence zones and suffosion, cracks can lead to disruption of the integrity of buildings and their destruction. The existing system of borehole thermal monitoring of the foundations of the structures does not provide sufficient information about the state of the soils in the area of the structures. The reason for this is the insufficient density of the network of thermometric wells. In addition, negative temperatures do not always indicate frozen ground conditions. Accordingly, there is a need for additional research methods, and here GPR comes in first place.
The figure below shows the GPR profile obtained in the zone of development of negative geocryological processes. GPR profiling was carried out at the end of August in the territory of Yakutia. The GPR profile shows the position of thermometric wells with measurements obtained at different times of the year.
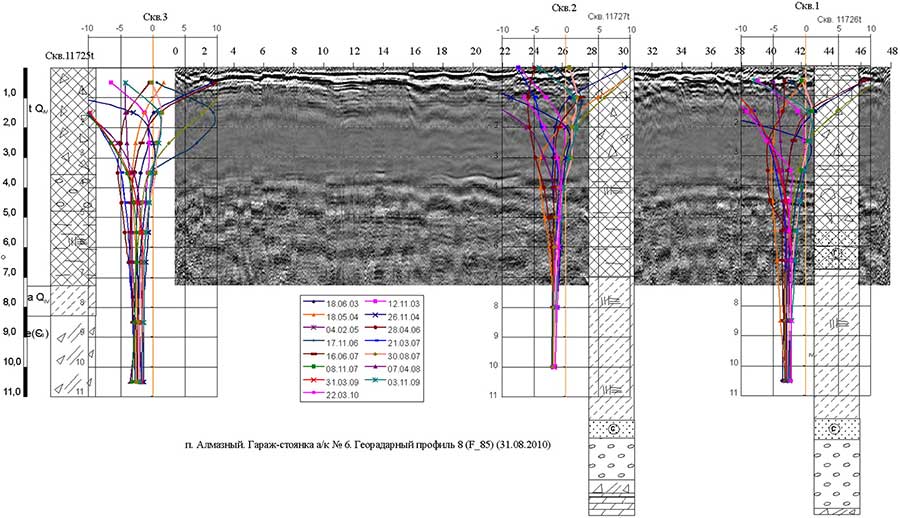
A visual analysis of the wave pattern of a GPR profile reveals a small number of diffracted reflections generated by subsurface local objects. The hodographs of the diffracted signals measure the propagation speeds of the probe GPR pulse. Based on the values of these velocities, using the formula known to all geophysicists, the dielectric constant values of the subsurface medium are calculated.
An inhomogeneous subsurface medium can be represented as a set of uniformly distributed in space local objects-reflectors, generating diffracted waves. For example, soils, as a rule, contain a lot of inclusions, the size of which is comparable with the wavelength of the probing GPR pulse. However, the vast majority of reflections from these objects have a weak intensity and are lost due to noise and interference. This happens because the electrophysical characteristics of such point objects do not differ much from the characteristics of the subsurface medium enclosing these objects.
In the case of a small number of visually distinguishable diffracted reflections, it is difficult to create a reliable model of the subsurface environment, showing all the features of its structure. The automated backscattering field analysis (BSEF) algorithm implemented in the GEORADAR-EXPERT software system is able to recognize and measure the characteristics of existing diffracted reflections masked by more intense signals and construct a fairly reliable model in the form of a section of one or another attribute of a subsurface medium or wave field.
The figure below shows the section of the attribute 'real part of the complex relative permittivity', which was created in GEORADAR-EXPERT based on the results of the automated BSEF analysis of the GPR profile discussed above. The thawed warm ground is displayed in yellow-red shades, the frozen soil - in shades of blue.
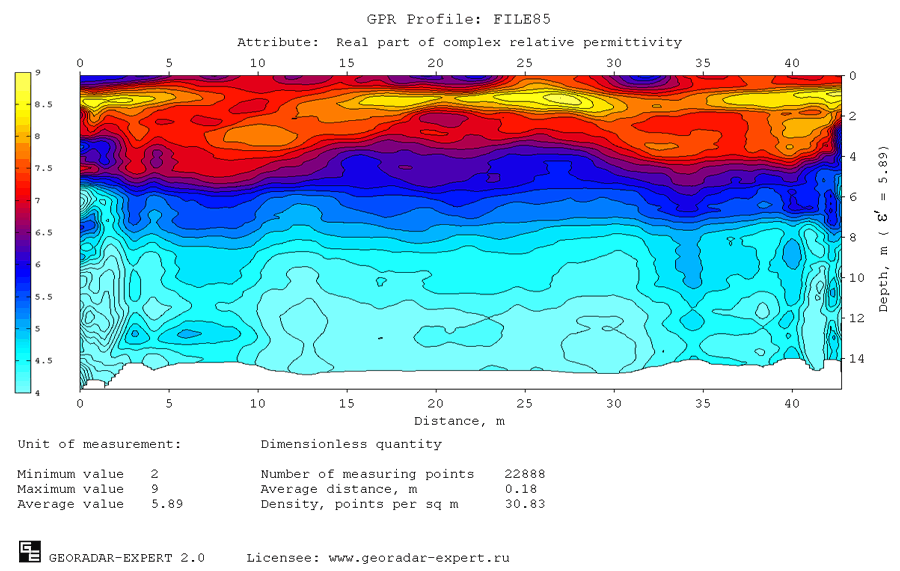
Knowing the range of permittivity values characteristic of frozen soils (3 - 5), it is possible to easily identify frozen and thawed areas of the section.
Note: on the presented section, the area of frozen soil has a slightly higher permittivity value. This occurs because the value of the wave velocity (on the basis of which the permittivity is calculated), measured by the diffracted reflection hodograph, is an average value for the depth range from the ground surface to the depth of the local reflector. And since the upper layer is in a thawed state and has a higher, compared to frozen soils, range of permittivity values, the zone of frozen soil that is located below the thawed layer will have elevated permittivity values on the section.
Undoubtedly, the attribute section calculated based on the result of the BSEF automated analysis is more informative than the wave patterns of the GPR profile - on the section, inside the thawed layer, you can see the most humid areas of soil and assess the degree of threat of the negative geocryological process for nearby buildings.
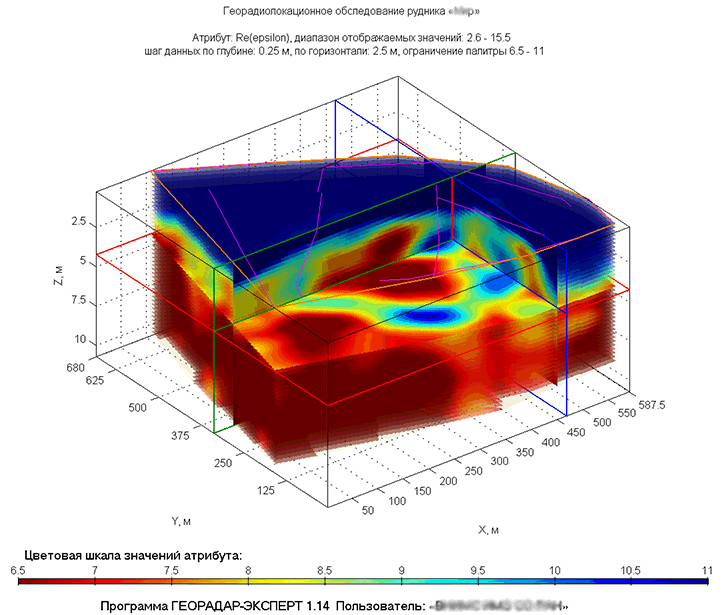
The results presented below were obtained during a GPR study of the mine site located in Yakutia. The purpose of the GPR study is to detect talik in permafrost soils. As a result of processing the field material in the software system GEORADAR-EXPERT, sections of the attribute 'Real part of the complex relative permittivity' were obtained, from which a 3D assembly was formed, the cross sections of which allowed us to get an idea of the soil condition of the studied area.
The figure below shows a 3D assembly with an orthogonal cut-out of the upper quarter of the cube. Areas of elevated permittivity values are displayed in blue and correspond to thawed soils. Red color indicates areas with low permittivity values and corresponds to frozen soils.
The following shows a horizontal cross-section of a 3D assembly at a depth of 4 meters overlapped on the plan of the site. The blue color of the cross section is thawed ground; the red color is frozen ground.
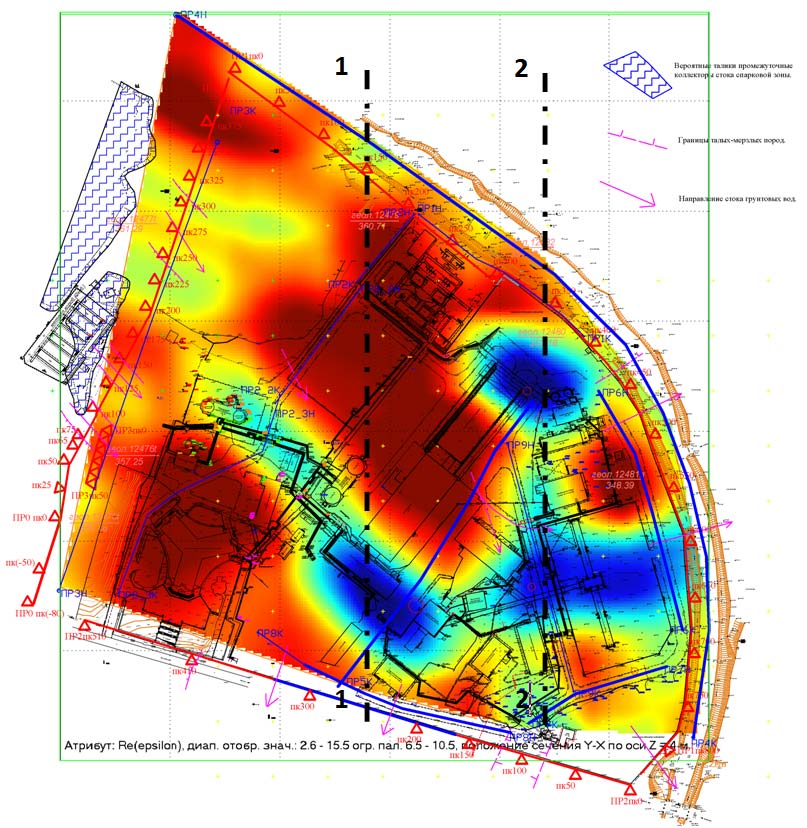
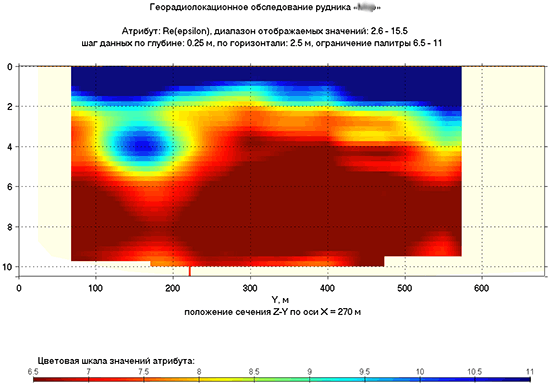
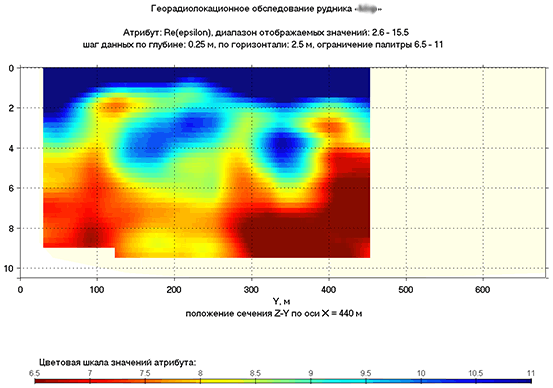
The following shows vertical sections of the 3D assembly along lines 1-1 and 2-2. The position of the cross-sections is shown by the bold dash-dotted lines in the figure above.
Without the use of the GEORADAR-EXPERT software system, it would be difficult to obtain such detailed and visual results of the study of the state of permafrost.