Sometimes in cemeteries, the presence of a tombstone does not mean the presence of a burial in this place. And the burials themselves may be unmarked. The mapping of burial sites is a delicate task that should be solved without violating the integrity of the investigated area. GPR is most suitable for the detection of burial sites, compared with other geophysical instruments - electrical survey equipment, magnetometer or metal detector. Compact size, high resolution of GPR data, speed of work, and visibility of the final result of the survey makes GPR an effective tool for the detection of burials and similar tasks.
GPR detects not only the presence of metal in the soil, but also on non-metallic objects (stones, wood, bones), as well as changes in the electrophysical characteristics of the subsurface examined, for example, due to density changes. GPR can register a response from the area of the disturbed soil, even if the excavation work was carried out many years ago.
As an example of the detection of burial, a fragment of the results of the GPR survey of the Archangel Cathedral of the Moscow Kremlin is presented. The Cathedral of the Archangel is an ancient necropolis of the Moscow ruling nobility and contains, in total, about a hundred tombs and burial places. The figure below shows the position of the GPR profiles and the results of profiling.
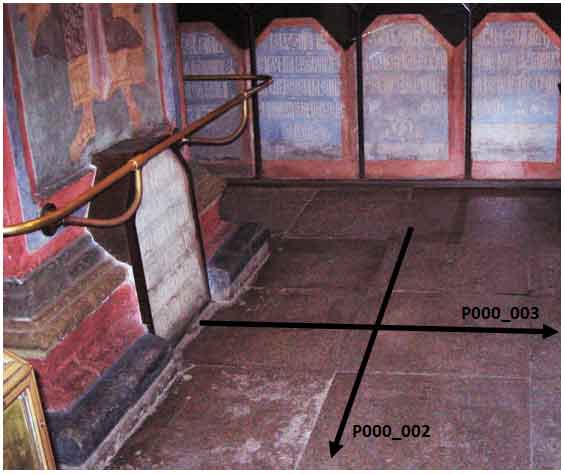
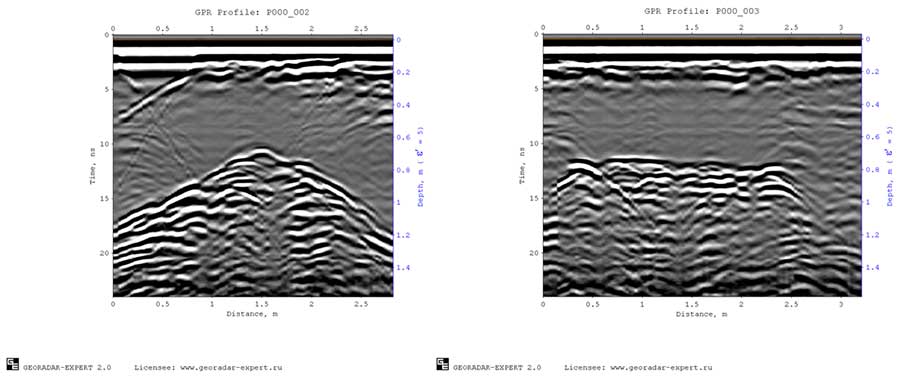
The survey was carried out shielded antenna 1700 MHz. GPR profiles crossed the burial in the longitudinal and transverse directions. In addition to compensating for the attenuation of signals with increasing depth, no additional processing of GPR data was carried out, since on GPR profiles reflections from the burial are already very clearly visible. This was facilitated by a small depth of burial, low attenuation of GPR signals in the studied medium (stone flooring and dry sand) and uniform soil.
There are situations when it is difficult to identify reflections from burial sites in the wave pattern of a GPR profile. The main reasons for this are the presence of numerous overlapping interference from objects on the surface (the so-called air reflections), high absorbing properties of the soil and its heterogeneity. The following steps will show the processing of a GPR profile that has strong overlapping interference. This GPR profile was obtained during a GPR survey of a memorial military cemetery.
The memorial military cemetery is a flat piece of land with a grass cover, on which identical monuments to soldiers are located. The distance between the monuments is about the same. From some graves, at one time, the remains were reburied, but some of the monuments were not dismantled afterwards and visually, the places with these empty graves are no different from the graves with remains.

The objective of this GPR research is to identify the graves that were vacated as a result of reburial. A shielded GPR antenna with a center frequency of 250 MHz moved along a series of gravestones along a grass lawn, crossing the burial sites. GPR profiling was coordinated using a GPR displacement sensor - a measuring wheel. At the time of coincidence of the center of the antenna and the center of the tombstone, the GPR operator put a mark on the records of the GPR profile. The soils during the field measurements were wet - some time before the start of work heavy rains occurred.
The figure below shows the raw result of GPR profiling:
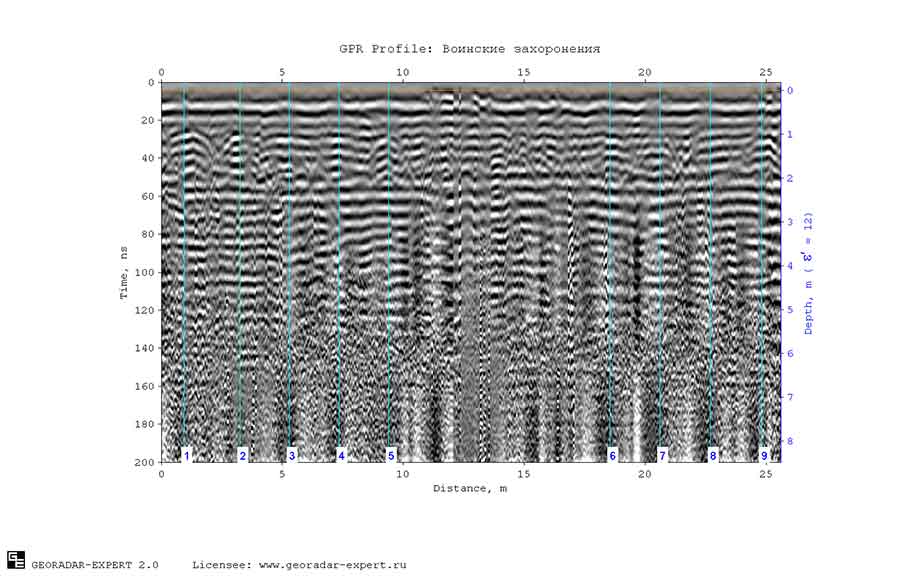
The vertical lines of blue color on the GPR profile are the operator marks opposite the gravestone structures. This profile crosses nine graves. Tag sequence numbers are listed at the bottom of the image. The wave pattern of the GPR profile contains numerous intense subhorizontal signals in-phase axes caused by multiple reflections of the GPR signals in wet ground. This interference masks diffracted reflections from objects in the ground. Note: the in-phase axes is a line connecting the same phases of received signals located on adjacent GPR traces and having the same or very close time values.
Usually, horizontal and sub-horizontal in-phase axes are removed by subtracting the average in a sliding horizontal window. This algorithm works like this: from each GPR trace, the trace is subtracted, which is the result of averaging a group of GPR traces symmetrically located in the neighborhood of the target GPR trace (GPR trace from which the subtraction is performed). The quantity of GPR trace in the averaging group is called the size of the subtraction window. This is a standard algorithm implemented in many programs for processing GPR data. The figures below show the subtraction results with windows of various sizes. The sizes of the subtraction windows, from left to right and from top to bottom: 11, 25, 99 and 513 (513 is the number of GPR traces in the GPR profile, in this case the so-called subtraction of the global average is performed).
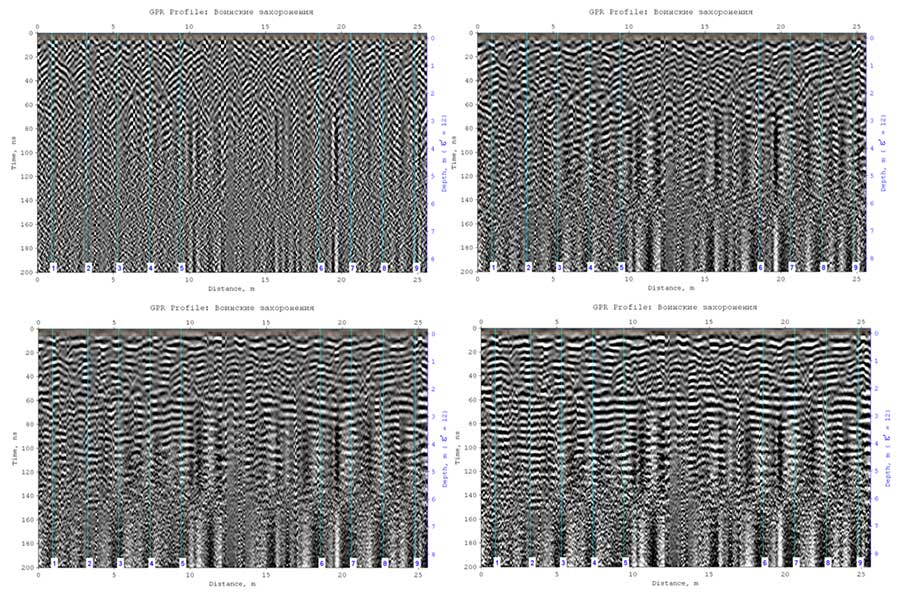
According to the results of the subtraction, it can be concluded that no one option has given a positive effect for cleaning the diffracted reflections from interferences for further analysis.
It is known that as it spreads, the frequency composition of GPR pulses changes. As a rule, the high-frequency components of the signals attenuate in the ground faster, and the low-frequency ones - more slowly. For this reason, the signals of low-frequency antennas of the GPR have a greater penetration depth than high-frequency ones. If on the GPR profile under consideration, interference is formed mainly as a result of reflections from the boundary between the turf layer and lower lying ground (this boundary is near the ground surface), and the remains are at a depth of one and a half to two meters, then reflections from the graves should have lower frequency than multiple reflection interference.
The figure below shows the result of frequency filtering based on Fourier transforms, which is implemented in the GEORADAR-EXPERT software package, and the spectra of the GPR profile signals before filtering (left) and after filtering. The shape of the filter window is shown by a red dotted line.
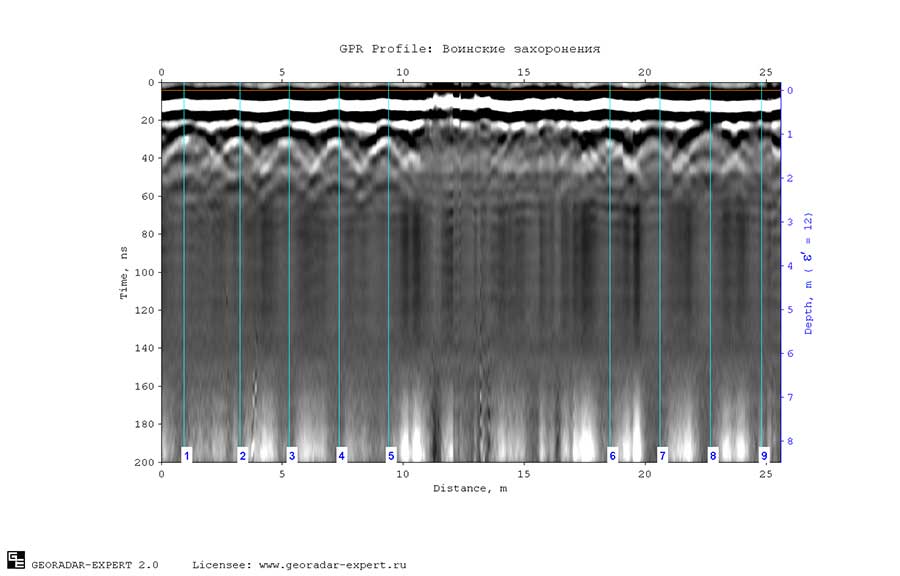
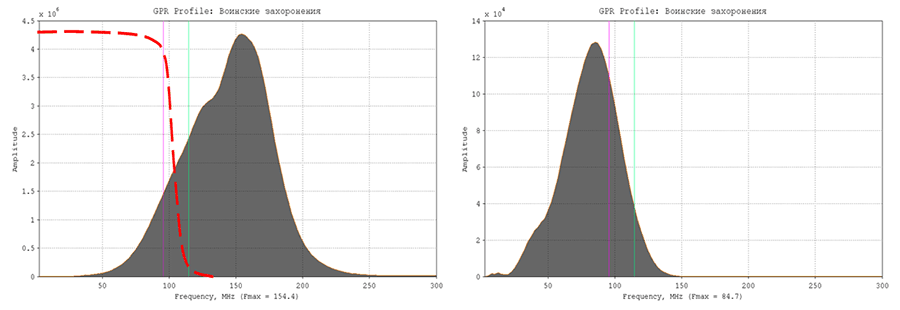
As a result of filtering, the center frequency of the GPR profile signals decreased from 154.4 MHz to 84.7 MHz, and much of the interference was suppressed. Diffracted reflections from graves became noticeable at the location of the marks, but intense reflection from the near-surface boundary makes it difficult to investigate the tops of the diffracted reflections. Subtraction of the average for the removal of this reflection, as well as in the case of its application to the untreated GPR profile, did not give satisfactory results. The figure below shows the result with subtraction windows 11 and 99:

For the software system GEORADAR-EXPERT, an algorithm has been developed and implemented that decomposes the GPR profile signals into components (this is not a wavelet transform). Each level of decomposition contains its own characteristic features of the wave pattern of the GPR profile. To remove the intense reflection from the boundary that masks the vertices of the diffracted reflections, it is necessary to decompose the signals into components, exclude decomposition levels containing information about this boundary and, based on the remaining decomposition levels, reconstruct the signal. The figure below shows the result of these actions:
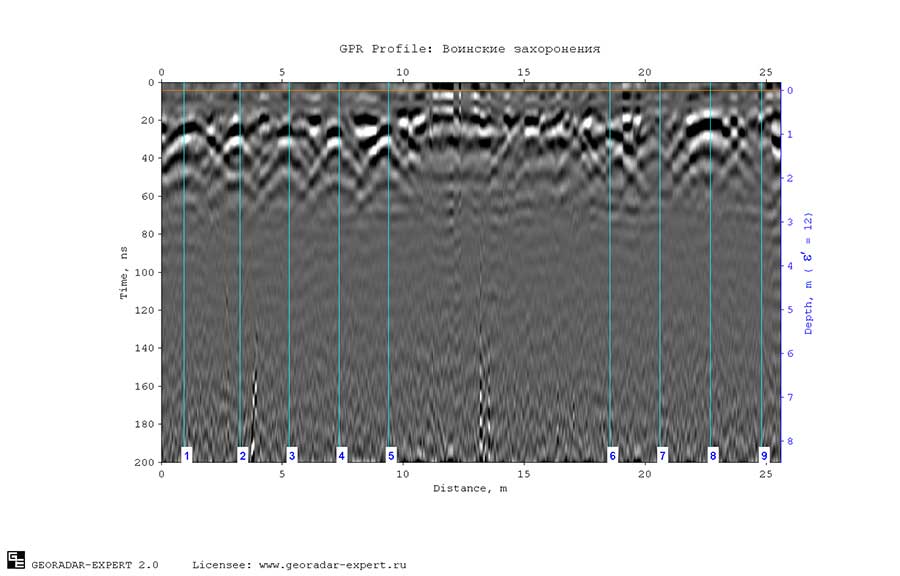
As a result of the processing, the diffracted reflections were cleared of interference and became suitable for analysis. First of all, it is necessary to know whether these are reflections from objects on the ground surface or from objects in the subsurface. For this, it is necessary to make a velocity analysis on the hodographs of the diffracted waves. Speed analysis shows that the propagation speed of GPR signals in the subsurface environment, on average, is 8.7 centimeters per nanosecond, which corresponds to the dielectric constant of the soil when it is wet — 12. Hence the conclusion that these reflections are not reflections from objects on the surface.
Diffracted reflections on the considered GPR profile can be divided into two groups - see the figure below:
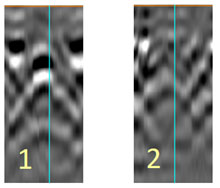
The reflections of the first group are clearer in comparison with the second group, and consist of two diffracted reflections, one above the other. The upper reflection is formed by the upper part of the remains, the lower - by the bottom of the grave. The top of the upper reflection is contrasting and well focused. The top of the lower reflection corresponds to the mark of the depth scale of 2 meters, which confirms the formation of this reflection by the bottom of the grave (usually, graves are dug to a depth of 2 meters). The reflections of the second group are less intense, the tops of the diffracted reflections are less contrasting, the lower reflections are absent.
Thus, based on the visual analysis of the processed GPR profile, we can conclude that the reflections of the first group are reflections from graves with remains. The position of these graves corresponds to the position of marks 1–5 and 8. The marks numbered 6, 7 and 9 indicate graves after reburial. These empty graves are filled with soil of approximately the same composition as the host soil, and for this reason reflections from the bottom of the graves are not visible due to the low dielectric contrast.
You can see that on the section of the profile from 15 meters to the mark 6 there are reflections that can be attributed to group 2 - i.e. empty graves. And since there were no tombstones in these places, the operator did not put any marks on the GPR profile in these places.
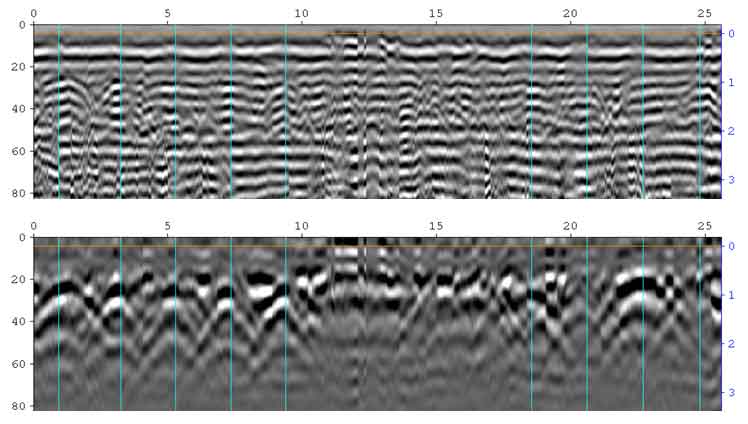
The figure below shows a comparison of GPR profile fragments containing useful signals before and after processing in the GEORADAR-EXPERT software system:
